A Race Between Two Runners
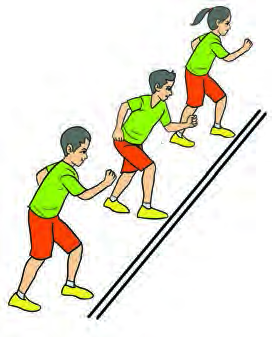
Watching a race at school, Suraj saw Rohan a little ahead of Binay on the track. A moment later, Binay had left Rohan behind. Instead of describing this whole event sentence by sentence, there is a better way to show it in a single picture, and that is a graph. If both boys run steadily, each at his own speed, and we plot time along the x-axis and displacement along the y-axis, the whole story of the race fits into just two lines.
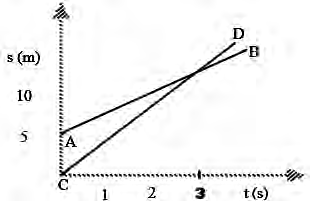
Look at the graph carefully. Line AB begins at point A, which sits 5 m up the displacement axis. That means this runner was already 5 m ahead when the race began, so this is Rohan's line. Line CD begins at the origin C, so it is Binay's line. Binay's line is steeper, because he covers more distance in every second. At 3 seconds the two lines cross at a single point. At that instant both runners have equal displacement, and after it Binay's line climbs above Rohan's. The graph shows every moment of the race in one glance.
What a Displacement Time Graph Is
A graph that shows the relation between the displacement of an object and the time taken for that displacement is called a displacement time graph, written in short as an s-t graph.
On a displacement time graph, time is placed on the x-axis and the matching displacement on the y-axis. The slope of the line drawn on the graph tells the velocity of the moving object. So a graph is not a decoration; it is a language of motion that can be calculated with. By reading the line we can find how fast the object is moving, when it stopped, and even when it turned back.
Slope Tells the Velocity
The slope of a line is the ratio of the rise to the run, that is, the change in displacement divided by the change in time between two points on the line.
To find the slope, choose any two points on the line. The change in displacement between them, \( \Delta s \), is the rise, and the change in time, \( \Delta t \), is the run. So the slope is \( \dfrac{\Delta s}{\Delta t} \). Since displacement is measured in metres and time in seconds, the slope comes out in m/s, which is the unit of velocity. That is why the slope of a displacement time line is the velocity of the object.
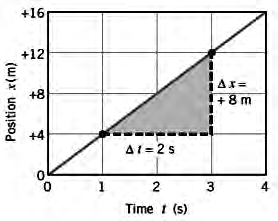
For the line shown in the graph above, the rise is 8 m and the run is 2 s. Working out the slope:
\[ \frac{8\ \text{m}}{2\ \text{s}} = 4\ \text{m/s} \]
In other words, the object is moving forward at a rate of 4 m every second. Because the line is straight, the slope comes out the same whichever two points we pick, so the velocity of the object is uniform.
Comparing Two Lines: Who Is Faster
By comparing the slopes of two displacement time lines, we can tell which object is moving faster and which slower. The line with the greater slope belongs to the faster object, and the line with the smaller slope belongs to the slower one. In the race graph, Binay's line CD is steeper than Rohan's line AB, so Binay is running faster. At the point where two lines cross, the distances covered by the objects are equal. In the race that point comes at 3 seconds, and from that moment on Binay is ahead.
The steeper the line, the faster the motion. The slope of the line on an s-t graph is the velocity of the object.
The Shape of the Line Shows the State of Motion
A displacement time line parallel to the x-axis shows that the object's distance is not increasing even though time is passing, which means the object is at rest. A straight sloping displacement time line shows a moving object travelling with uniform velocity, because a straight line has the same slope everywhere. If the line on a displacement time graph is curved, the moving object has non-uniform velocity, because the slope of a curve is different at different places.
| Shape of the line | State of the object | Velocity |
| Straight line parallel to the time axis | At rest | Zero velocity |
| Straight sloping line | Moving | Uniform velocity |
| Curved line | Moving | Non-uniform velocity |
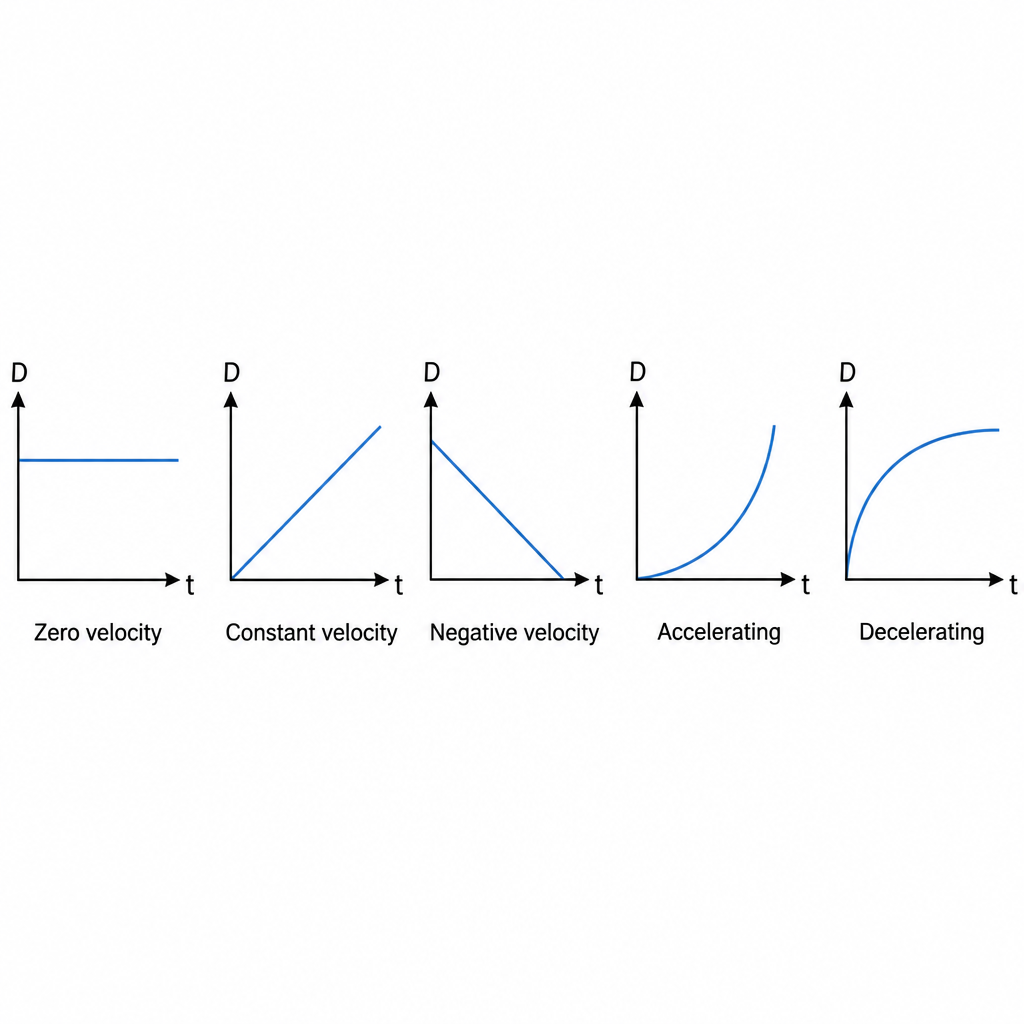
What if the line slopes downward? It means the displacement is decreasing as time passes, so the object is coming back toward its starting place. The slope of such a line is negative, and the negative sign on the velocity tells us the object is moving in the opposite direction.
The line on an s-t graph is not a map of the road. A line climbing upward does not mean the object is going uphill; it only means the displacement is increasing with time. In the same way, a line parallel to the time axis does not mean the object is moving steadily; it means the object has stopped.
Reading a Graph Segment by Segment
Real motion is rarely steady from start to finish, so one graph often carries segments of different shapes. The graph below shows the motion of a man walking steadily along a straight road while a dog tries to chase him, over a period of 10 s. In segment AE the line is straight and the slope is the same between any two points, so the man is walking with uniform velocity. In segment EH the line is curved and grows steeper and steeper. The slope is different at different pairs of points, so the velocity is non-uniform; seeing the dog, the man runs faster and faster. In segment HI the line is parallel to the time axis, so the man has stopped and is at rest.
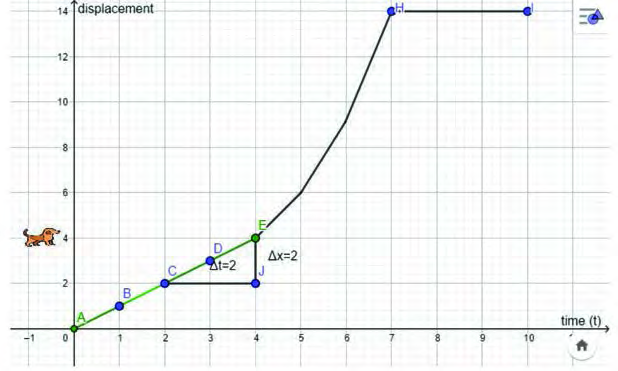
Make it a habit to read any displacement time graph segment by segment: first recognise the shape of each segment, then, where needed, calculate the slope of each segment to find its velocity. With this one skill, the full story of any object's journey can be told from its graph.
The full lesson is waiting for you
The notes are free to read in full. A free account opens the rest of the practice, and tracks your progress and confidence score for every subject. Presentations and videos need approval from Learn Yeti.