What a Whisker Box Plot Shows
Suppose two classes both have a mean height of 130 cm. Does that mean the two classes look alike? Not always. In one class almost every student could be between 125 cm and 135 cm tall. In the other class there could be some very short students and some very tall ones. The mean is the same, but the heights are spread out in very different ways.
In statistics, the whisker box plot is a reliable way to see the real shape of a set of data and to compare two groups in a meaningful way. The mean alone can sometimes hide the real variation inside the data. A box plot does not hide it. It gives a clear picture of the distribution of the data, which is how the values are arranged along the scale, and of the spread of the data, which is how widely the values are scattered.
Whisker box plot: a diagram of a set of data in which the middle 50% of the data is drawn as a box and the remaining 50% is drawn as lines on both sides of the box. These side lines are called whiskers.
A whisker box plot is built from only five values of the data: the lowest value, the first quartile, the median, the third quartile and the highest value.
Reading a Whisker Box Plot
The whisker box plot below is drawn from the heights of a group of students, measured in centimetres. The heights run along a horizontal number line from 90 cm to 160 cm. Five points on the plot are labelled A, B, C, D and E.
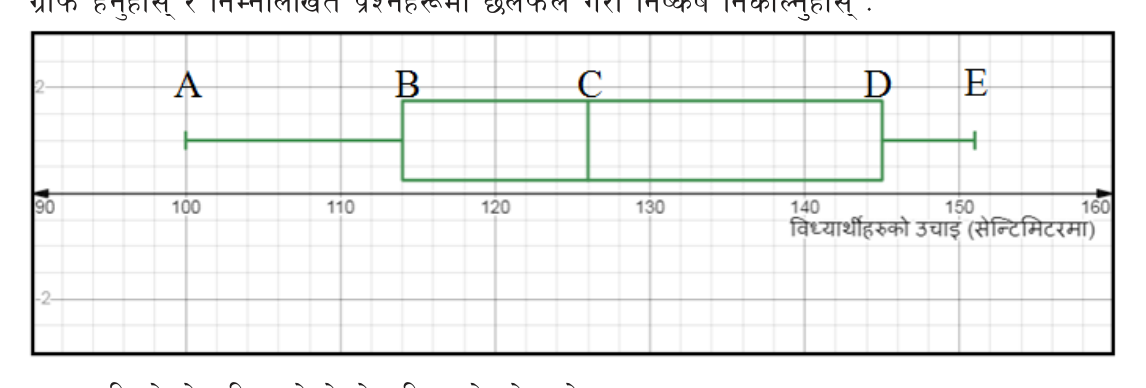
To read a point, look straight down from it to the number line. Point A sits above 100, point B above 114, point C above 126, point D above 145 and point E above 151. So the shortest student in the group is 100 cm tall and the tallest is 151 cm tall.
The rectangle stretches from B to D, and a vertical line cuts across it at C. The two horizontal lines, one from A to B and one from D to E, are the whiskers. Each of the five points stands for one particular value of the data, as the table shows.
| Point | What it stands for | Value in the height plot |
| A | Lowest value | 100 cm |
| B | First quartile \( Q_1 \) | 114 cm |
| C | Median \( Q_2 \) or \( M_d \) | 126 cm |
| D | Third quartile \( Q_3 \) | 145 cm |
| E | Highest value | 151 cm |
So, for this group of students, the lowest height is 100 cm, the first quartile is 114 cm, the median is 126 cm, the third quartile is 145 cm and the highest height is 151 cm. The part from A to B and the part from D to E are the whiskers. The part from B to D is the box.
The Five Values
Every whisker box plot is drawn from the same five values, and they always appear in the same order from left to right: lowest value, first quartile, median, third quartile, highest value. Three of them are quartiles, so it helps to be clear about what a quartile is.
Quartiles: the three values that divide a set of data, arranged in ascending order, into four equal parts. They are the first quartile \( Q_1 \), the second quartile \( Q_2 \) and the third quartile \( Q_3 \).
Lowest value: the smallest number in the data. It is the left end of a whisker box plot.
First quartile \( Q_1 \): the value below which one quarter (25%) of the data lies when the data are in ascending order. It is the left edge of the box.
Median \( M_d \): the middle value of the data arranged in ascending order. Half of the data lies below it and half above it. The median is the same as the second quartile \( Q_2 \), and it is drawn as the line inside the box.
Third quartile \( Q_3 \): the value below which three quarters (75%) of the data lies when the data are in ascending order. It is the right edge of the box.
Highest value: the largest number in the data. It is the right end of a whisker box plot.
The Box and the Whiskers
The box is drawn from \( Q_1 \) to \( Q_3 \). One quarter of the data lies between \( Q_1 \) and the median, and another quarter lies between the median and \( Q_3 \). Together that makes half the data, so the box holds the middle 50% of the data.
The whiskers carry the other 50%. The left whisker runs from the lowest value to \( Q_1 \) and holds the lowest quarter of the data. The right whisker runs from \( Q_3 \) to the highest value and holds the highest quarter.
Box: the rectangle of a whisker box plot, drawn from the first quartile to the third quartile, with a line across it at the median. It shows the middle 50% of the data.
Whiskers: the two lines on either side of the box. One joins the lowest value to the first quartile, and the other joins the third quartile to the highest value.
The lengths of these parts tell a story. In the height plot, the left whisker runs from 100 to 114, so it is 14 cm long. The right whisker runs from 145 to 151, so it is only 6 cm long. This means the tallest quarter of the students are close together in height, while the shortest quarter are more spread out. Inside the box, the median at 126 sits nearer to 114 than to 145. The students between 114 cm and 126 cm cover 12 cm, but those between 126 cm and 145 cm cover 19 cm, so the second group is more spread out.
Each of the four parts of a box plot holds about one quarter of the data: the left whisker, the left half of the box, the right half of the box and the right whisker. A long part means that quarter is spread out. A short part means that quarter is bunched together.
Finding the Quartiles
To draw a box plot from a list of raw data, the median and the quartiles must be found first. The data are arranged in ascending order, and \( N \) stands for the number of values. The formulas below give the POSITION of each value in the ordered list.
\[ Q_1 = \left(\frac{N+1}{4}\right)^{\text{th}} \text{ term} \]
\[ M_d = \left(\frac{2(N+1)}{4}\right)^{\text{th}} \text{ term} \]
\[ Q_3 = \left(\frac{3(N+1)}{4}\right)^{\text{th}} \text{ term} \]
After finding a position, count along the ordered list to that term. The number sitting in that place is the quartile. The lowest value and the highest value need no formula at all. They are simply the first and the last numbers of the ordered list.
The formula \( \left(\frac{N+1}{4}\right)^{\text{th}} \) term tells you WHERE the first quartile is, not what it is. For eleven values it gives 3, which means the 3rd number of the ordered list. The quartile is that number, not 3. Counting also works only after the data are in ascending order. Counting along an unsorted list gives a wrong quartile.
Steps to Draw a Whisker Box Plot
Follow these four steps, in this order, every time you draw a whisker box plot.
- Step 1: Arrange the given data in ascending order.
- Step 2: Find the lowest value, the median, the quartiles and the highest value of the data.
- Step 3: Draw a number line with a suitable scale on the graph, and mark the five main values on it: the lowest value, the first quartile, the median, the third quartile and the highest value.
- Step 4: Draw a box between the first quartile and the third quartile, with a line across it at the median. Then draw a line from the lowest value to the first quartile, and another from the highest value to the third quartile.
Example 1: Ages of Eleven Students
The ages of eleven students, in years, are 13, 17, 16, 14, 11, 13, 10, 16, 11, 18 and 12. Find the lowest value, the first quartile, the median, the third quartile and the highest value of the data, and show them in a whisker box plot.
Step 1: Arranging the ages in ascending order:
\[ \begin{gathered} 10,\ 11,\ 11,\ 12,\ 13,\ 13, \\ 14,\ 16,\ 16,\ 17,\ 18 \end{gathered} \]
Step 2: Counting the ages gives \( N = 11 \). The first number of the ordered list is the lowest value:
\[ \text{Lowest value} = 10 \]
Step 3: Putting \( N = 11 \) into the formula for the position of the first quartile:
\[ \left(\frac{11+1}{4}\right)^{\text{th}} \text{ term} = 3^{\text{rd}} \text{ term} \]
Step 4: Counting to the 3rd term of the ordered list, which is 11:
\[ Q_1 = 11 \]
Step 5: Finding the position of the median:
\[ \left(\frac{2 \times 12}{4}\right)^{\text{th}} \text{ term} = 6^{\text{th}} \text{ term} \]
Step 6: Counting to the 6th term of the ordered list, which is 13:
\[ M_d = 13 \]
Step 7: Finding the position of the third quartile:
\[ \left(\frac{3 \times 12}{4}\right)^{\text{th}} \text{ term} = 9^{\text{th}} \text{ term} \]
Step 8: Counting to the 9th term of the ordered list, which is 16:
\[ Q_3 = 16 \]
Step 9: Reading the last number of the ordered list as the highest value:
\[ \text{Highest value} = 18 \]
Step 10: Drawing the plot. A number line from 9 to 19 years is drawn with one small square for each year, and the five values 10, 11, 13, 16 and 18 are marked above it. A box is drawn from 11 to 16 with a line across it at 13. One whisker joins 10 to 11, and the other joins 16 to 18.
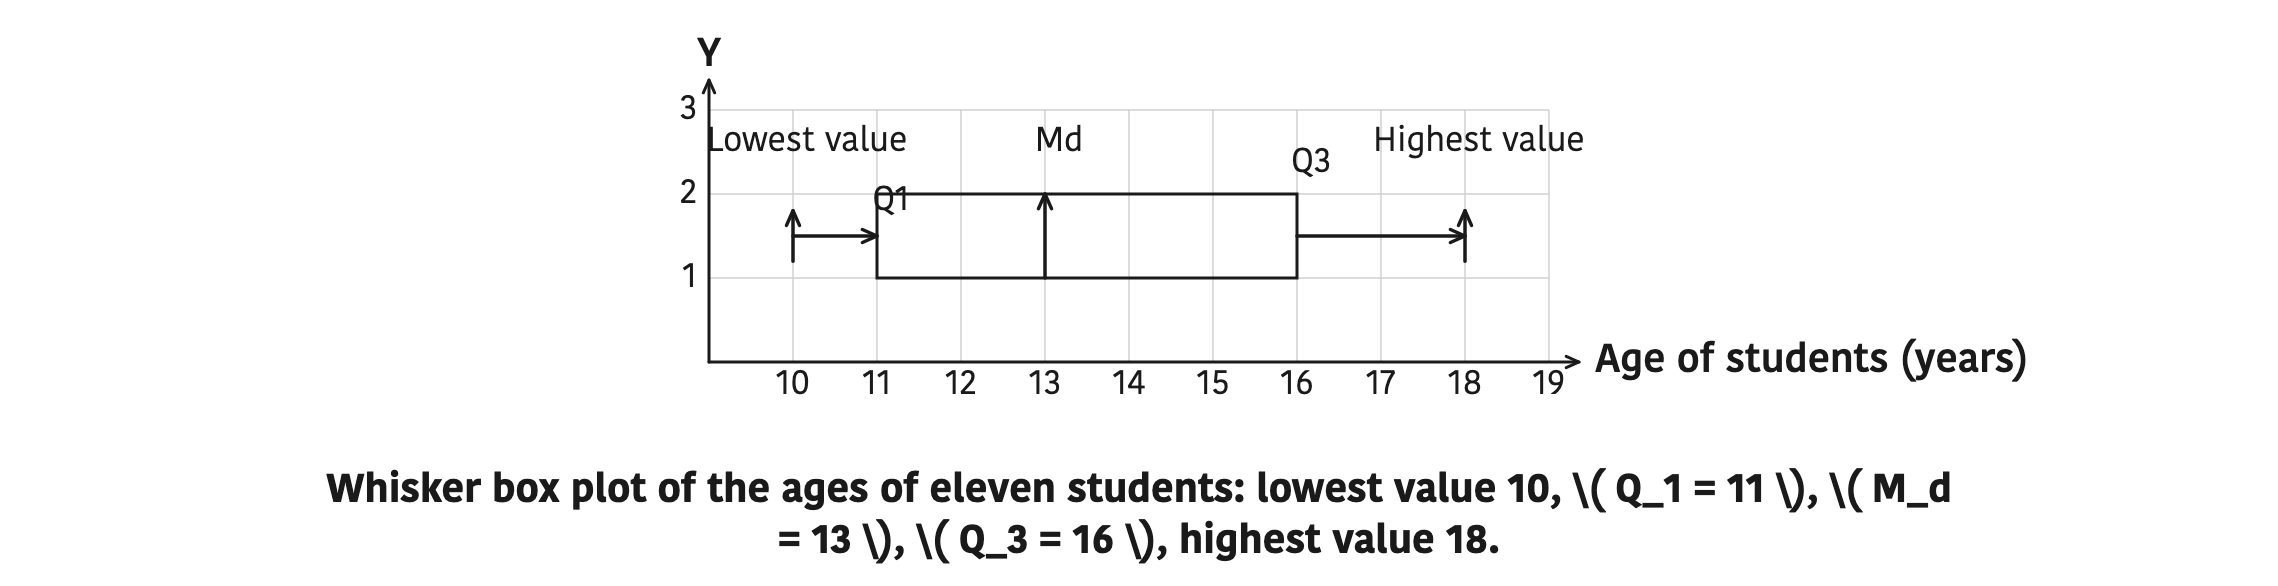
Reading the finished plot: the right whisker, from 16 to 18, is longer than the left whisker, from 10 to 11. So the oldest quarter of these students are more spread out in age than the youngest quarter. The median at 13 is also closer to \( Q_1 \) than to \( Q_3 \), so the ages above the median are more spread out than the ages below it.
Example 2: Marks of Fifteen Students
Fifteen students sat a test out of 50 marks. Their marks were 32, 45, 28, 38, 41, 25, 36, 30, 48, 35, 40, 27, 33, 44 and 38. Show the marks in a whisker box plot.
Step 1: Arranging the marks in ascending order:
\[ \begin{gathered} 25,\ 27,\ 28,\ 30,\ 32,\ 33,\ 35,\ 36, \\ 38,\ 38,\ 40,\ 41,\ 44,\ 45,\ 48 \end{gathered} \]
Step 2: Counting gives \( N = 15 \). Reading the two ends of the ordered list:
\[ \text{Lowest value} = 25 \]
\[ \text{Highest value} = 48 \]
Step 3: Finding the position of the first quartile with \( N = 15 \):
\[ \left(\frac{15+1}{4}\right)^{\text{th}} \text{ term} = 4^{\text{th}} \text{ term} \]
Step 4: Counting to the 4th term, which is 30:
\[ Q_1 = 30 \]
Step 5: Finding the position of the median:
\[ \left(\frac{2 \times 16}{4}\right)^{\text{th}} \text{ term} = 8^{\text{th}} \text{ term} \]
Step 6: Counting to the 8th term, which is 36:
\[ M_d = 36 \]
Step 7: Finding the position of the third quartile:
\[ \left(\frac{3 \times 16}{4}\right)^{\text{th}} \text{ term} = 12^{\text{th}} \text{ term} \]
Step 8: Counting to the 12th term, which is 41:
\[ Q_3 = 41 \]
Step 9: Drawing the plot. A number line from 20 to 50 marks is drawn and the five values 25, 30, 36, 41 and 48 are marked on it. The box runs from 30 to 41 with a line across it at 36. One whisker joins 25 to 30, and the other joins 41 to 48.
Reading the finished plot: the middle half of the class scored between 30 and 41 marks. The left whisker covers 5 marks and the right whisker covers 7 marks, so the top quarter of the class is a little more spread out than the bottom quarter.
The full lesson is waiting for you
The notes are free to read in full. A free account opens the rest of the practice, and tracks your progress and confidence score for every subject. Presentations and videos need approval from Learn Yeti.