Questions whose answers live with people
Not every scientific question can be answered inside a laboratory. A test tube and a beaker show how a substance behaves, but they cannot tell you how the families in your neighbourhood handle the waste that leaves their kitchen, or how many of them turn that waste into compost. The answer to a question like that sits with people, in their homes, in the daily habits of a whole community.
So science has a method built for exactly this situation. The person doing the study goes out to the place itself, asks the people who live there, writes down what they say, then puts all those answers side by side and reads what the pile of answers shows. That method is a survey. One household's answer tells you almost nothing, but fifty answers placed together give an honest picture of the whole neighbourhood.
What a survey is
Survey: going in person to the area connected with a subject or a problem, collecting data there, and reaching a conclusion from that data.
Three things are tied together in that sentence, and all three are needed. First, the student has to reach the place itself. Second, what is brought back has to be data, meaning information that can be counted and compared. Third, that data has to be analysed until it yields a conclusion. Reaching the place and bringing back no data is just a walk, and bringing back data that nobody analyses is just a pile of paper.
A survey is the right choice when the thing being studied is spread across many people, many homes or a wide area. If you want to know whether the farmers of a district use more chemical fertiliser or more organic manure, testing one field will not answer it. You have to ask many farmers, and only a survey lets you do that.
The tools a survey uses
When a survey is carried out, the data is gathered through a questionnaire, an interview guideline, a group discussion or an observation guideline, and every one of these stays focused on the subject or problem being studied. These are called the tools of a survey. A tool is the prepared format used to collect the data, and it is made before anyone goes into the field.
Questionnaire: a sheet carrying an ordered set of questions that match the aim of the study, on which the answer given by each person is recorded.
Interview guideline: a prepared list of the points to be asked while talking face to face with the person being studied.
Data: information collected in a form that can be counted, compared and turned into percentages.
| Tool | What it is | When it suits |
| Questionnaire | A sheet of set questions with options | When the same information is needed quickly from many homes |
| Interview guideline | A list of points to ask | When a person's experience has to be understood in depth |
| Group discussion | Open talk with a group | When the shared view of a community is wanted |
| Observation guideline | A prepared list of what to look at | When what people do matters more than what they say |
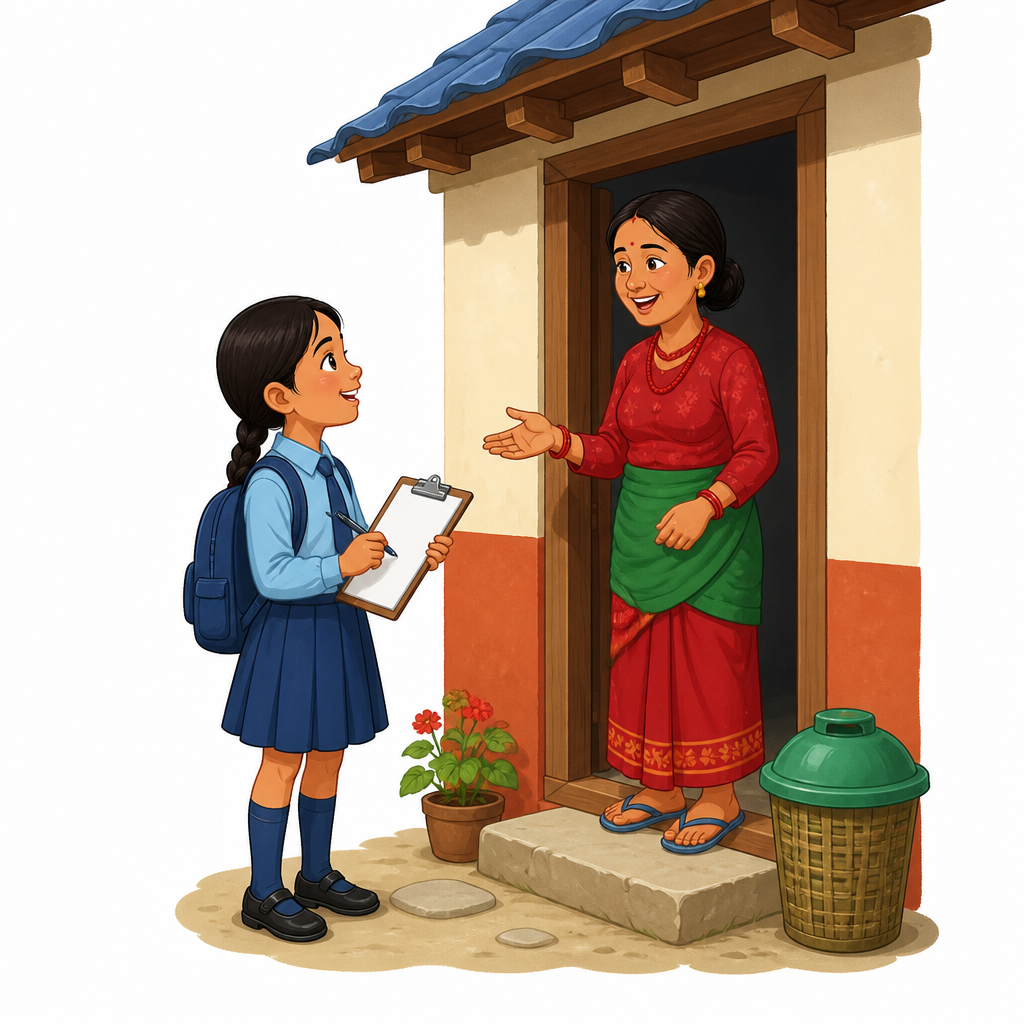
Never write a question that hands the person the answer. Asking "You make compost, don't you?" pushes the person to say yes and the data is spoiled before it is even collected. And never fill in a missing answer by guessing what the household probably does.
The five steps of a survey
A survey is normally carried out through the following steps. They run in order, and a later step cannot begin until the one before it is finished.
- (a) Choosing the aim: settling in one clear sentence what is to be found out.
- (b) Choosing the method of data collection: deciding whether a questionnaire, an interview or observation will be used, and preparing that tool.
- (c) Collecting the data: reaching the selected households or people and recording their answers.
- (d) Analysing the data: counting the answers, grouping them, turning them into percentages and seeing what shows up.
- (e) Conclusion: tying what the analysis shows back to the aim and stating the answer.
The aim is chosen first because the aim is what decides which questions go on the questionnaire.
How the report is put together
Once the survey has been completed through those steps, a report is written. The report carries the title of the study, its aim, the tools and method used to collect the data, the analysis, the conclusion and the suggestions that follow from it. Without a report the work may have been done, but its result never reaches anybody else.
Report: the written document that sets out everything from the aim of the survey to its conclusion and suggestions, in order.
Title: in a single line, what was studied and where.
Background: an introduction to the area and why this subject matters there.
Aim: what the study set out to find.
Tools and method: which tool was made and how many people were asked.
Analysis of the data: the counted answers, the percentages and a diagram.
Conclusion and suggestions: what the data showed, and the improvement it points to.
A sample report: solid waste in one neighbourhood
Title: A study of solid waste management in one neighbourhood of Kathmandu. The background runs like this. The area surveyed is a culturally rich neighbourhood inside the old city of Kathmandu. It holds a number of temples and monasteries of archaeological importance. The people there earn their living mainly through trade and salaried jobs, and some through farming as well. With the modern way of living, solid waste has now appeared there as a problem.
Aim: to study the way solid waste is managed in the area of study. In other words, the study asks how the people there deal with the waste that leaves their houses each day. The hope is that the conclusion will help other areas manage their solid waste too.
Method of data collection: a questionnaire was built about the way solid waste is handled, and 50 households were selected for the survey. The data needed was then collected using that questionnaire.
Turning counts into percentages
The answers are counted first, and then turned into percentages. Percentages make it easy to compare one survey with another even when the two studied a different number of homes. Suppose 25 of the 50 households put their waste out unsorted. Let us work out what share of the total that is.
Step 1: The counted number is written over the total number of households:
\[ \frac{25}{50} \]
Step 2: To get a percentage, that fraction is multiplied by 100:
\[ \frac{25}{50} \times 100 \]
Step 3: Carrying out the division first:
\[ \frac{25}{50} = 0.5 \]
Step 4: Multiplying by 100 gives the percentage:
\[ 0.5 \times 100 = 50 \]
So 25 households out of 50 is 50 percent. In the same way 15 households is 30 percent and 10 households is 20 percent. The three percentages must add up to 100, and if they do not, a counting mistake has crept in somewhere.
The analysis, the bar diagram and the conclusion
The analysis of the collected data showed that 50 percent of the households put their solid waste into the municipal vehicle without sorting it at all. Thirty percent were found to sort their waste and make compost from the part that rots. The remaining 20 percent sort their waste, make compost from the rotting part and also turn the part that does not rot into various useful articles. The result is presented in a bar diagram.
Bar diagram: a picture in which the size or percentage of each group is shown by the height of an upright bar, so the comparison can be taken in at a glance.
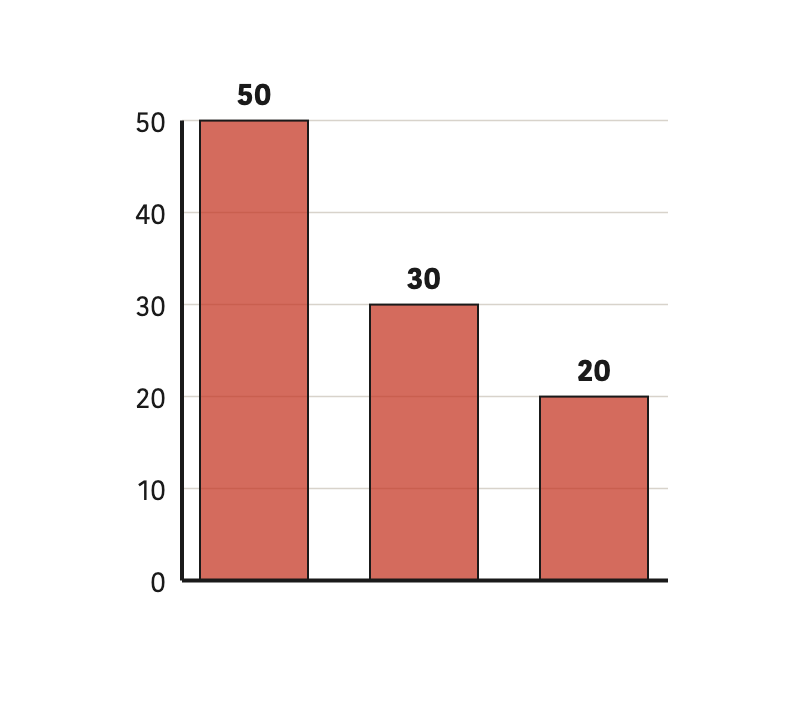
To read a bar diagram, look first at the numbers running up the upright line. Here that line is marked from 0 to 60 in steps of ten. Whatever number the top of a bar reaches is the percentage for that group. The tallest bar shows the practice followed by the largest number of households, and here that practice is throwing the waste away without sorting it.
Conclusion: the result of the survey shows that the practice of recycling and reuse has begun in the area studied. Half the households still do not sort their waste, but the other half have started to, and the report suggests spreading that change further.
A conclusion must never claim more than the data shows. A study of 50 households speaks about that neighbourhood, not about the whole of Kathmandu. A sentence like "everybody in the city is now aware" simply does not follow from these numbers.
The questionnaire used in the study
The questionnaire used in this study was the following. Each question carries a set of options, so that the household can simply choose one and the answers can be counted easily afterwards. The first question:
1. What do you do with the waste that comes out of your house?
- (a) Hand it to the body that collects waste
- (b) Manage some of it at home and hand the rest to the body that collects waste
- (c) Manage all of it at home
2. What do you do with the waste that rots?
- (a) Make compost from it
- (b) Throw it on the road or into the river
3. What do you do with the waste that does not rot?
- (a) Use it to make various articles
- (b) Collect it and hand it to the collection centre
- (c) Burn it or bury it in a pit
These three questions are tied straight to the aim. The first shows whether waste is managed at home at all, and the second and third show what is done separately with the part that rots and the part that does not. A question that is not tied to the aim has no place on the sheet, because it only eats up the time of the person answering.
Running your own survey
Now it is your turn to use the same method. You can survey at least 50 homes in your own community to find out how solid waste is handled there. Work through it like this.
- Write the aim of your study in a single sentence.
- Prepare a questionnaire of three or four questions that match the aim, giving options under each.
- Visit at least 50 households, record the answers and write each one down on the spot.
- Count the answers group by group and turn each group into a percentage.
- Draw the percentages as a bar diagram, then write a report with a title, background, aim, method, analysis, conclusion and suggestions, and present it to the class.
Another survey can be done on food. Using an interview, a questionnaire or any other means, survey at least 30 people or families about the different methods they use to preserve food, and prepare a report on it. The tool may be different here, but the five steps stay exactly the same.
The strength of a survey lies in numbers. The more homes or people you ask, the more dependable the result becomes.
The full lesson is waiting for you
The notes are free to read in full. A free account opens the rest of the practice, and tracks your progress and confidence score for every subject. Presentations and videos need approval from Learn Yeti.