Median: the Middle Value of Data
Suppose nine friends line up for a photograph from the shortest to the tallest. The friend standing fifth has four people on the left and four on the right, so that friend's height sits exactly in the middle of the group. In statistics this middle value is called the median. Once any data is arranged in order, the median splits it into two equal halves: there are as many values below it as above it.
Median (\( M_d \)): the value that divides data, arranged in ascending or descending order, into two exactly equal parts.
The median is useful because one very large or very small value cannot pull it towards itself. Five friends have pocket money of Rs 20, Rs 25, Rs 30, Rs 35 and Rs 500. Their mean is Rs 122, which is more than four of the five actually have. Their median is Rs 30, which describes the group far better.
Data reaches us in three forms, and the way of finding the median changes with the form. An individual series is a plain list of values. A discrete series gives each value together with its frequency, the number of times it occurs. A continuous series groups the values into class intervals such as 0-10 and 10-20 and gives the frequency of each class.
Median of an Individual Series
First arrange all the values in ascending (or descending) order. Then count them. If there are \( N \) values, the median is the item at this position:
\[ \text{Position} = \left(\frac{N+1}{2}\right)^{\text{th}} \text{ item} \]
Example: Seven students scored these marks in a 20-mark test: 12, 7, 15, 9, 18, 11, 14. Find the median.
Step 1: Arranging the marks in ascending order:
\[ 7,\ 9,\ 11,\ 12,\ 14,\ 15,\ 18 \]
Step 2: Finding the position of the median with \( N = 7 \):
\[ \frac{N+1}{2} = \frac{7+1}{2} = 4 \]
Step 3: Reading the 4th value from the ordered list:
\[ M_d = 12 \]
Three marks lie below 12 and three lie above it, so the median mark is 12. Now suppose an eighth student scored 20. The ordered list becomes 7, 9, 11, 12, 14, 15, 18, 20, and \( N = 8 \).
Step 1: Finding the position of the median:
\[ \frac{8+1}{2} = 4.5 \]
Step 2: The 4.5th item lies halfway between the 4th item (12) and the 5th item (14), so taking their average:
\[ M_d = \frac{12+14}{2} = 13 \]
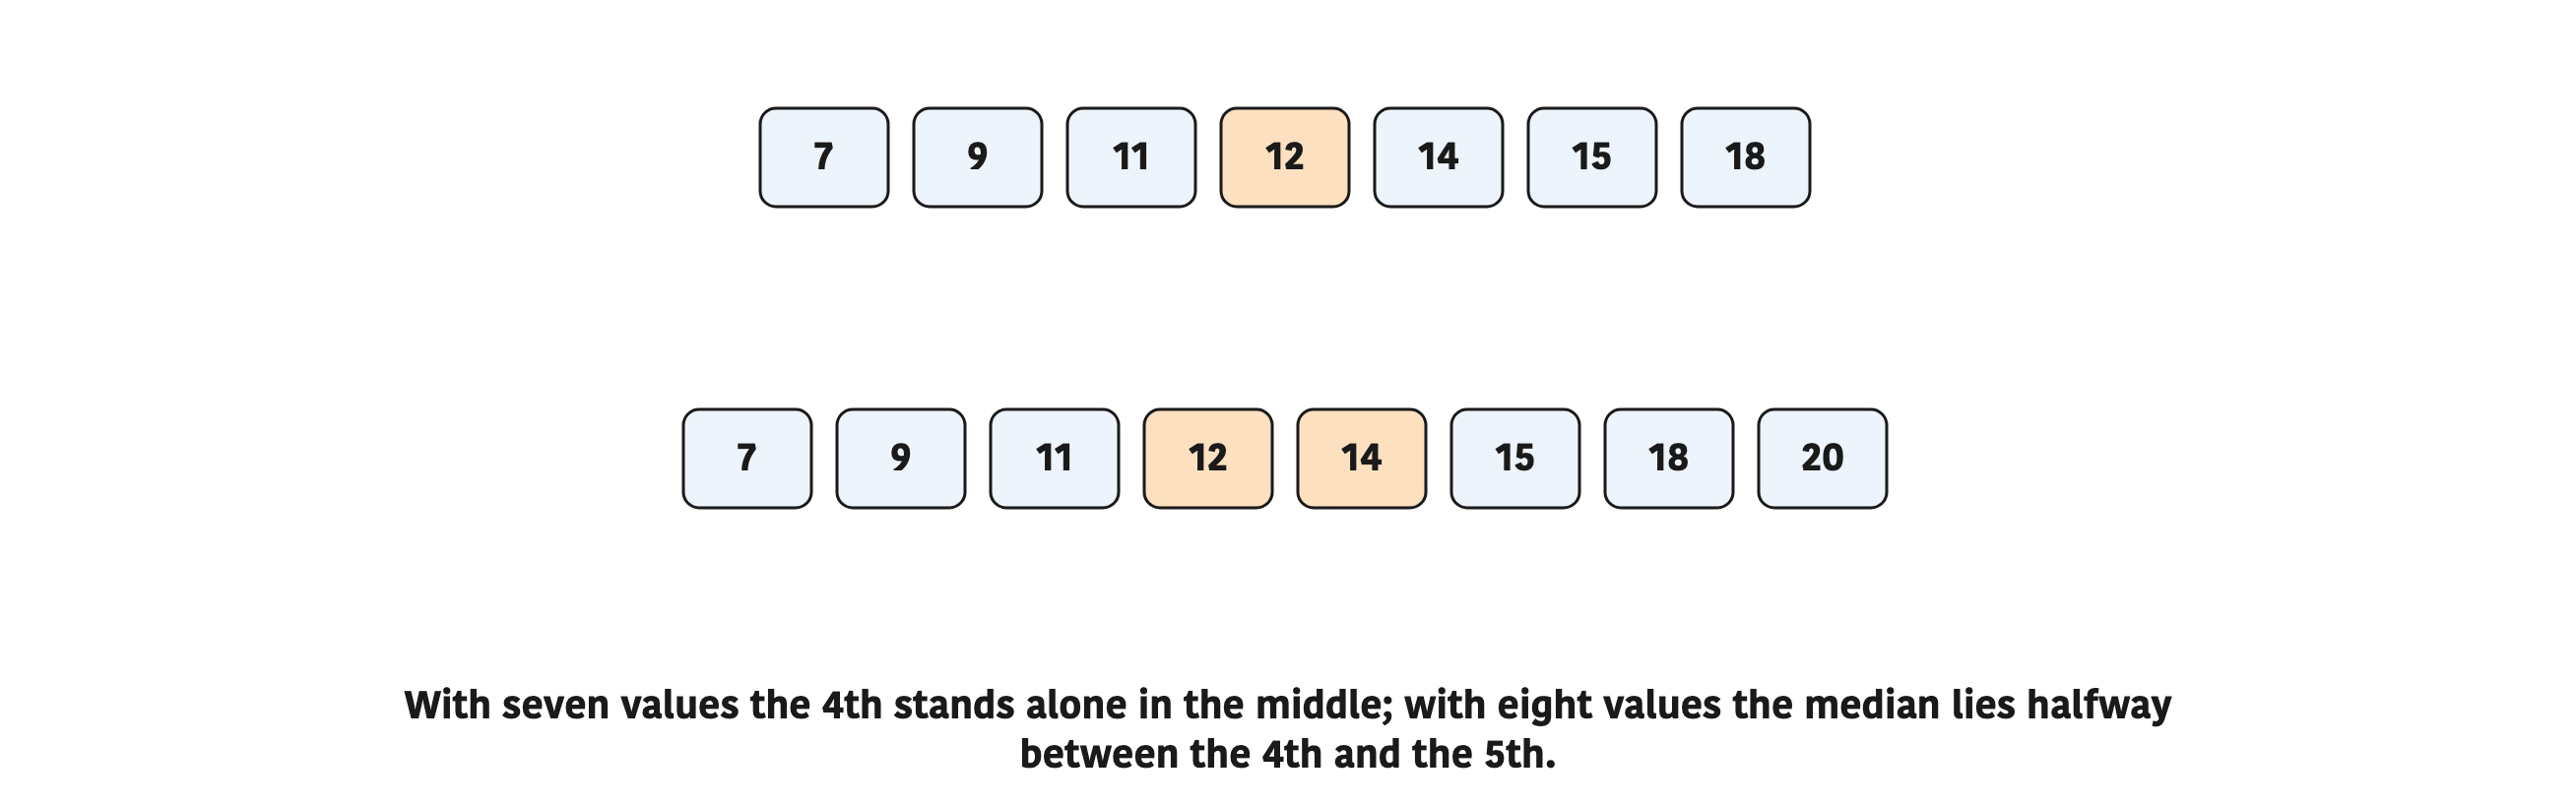
When the number of values is odd, the median is one of the values. When it is even, the median is the average of the two middle values, and it may not appear in the list at all.
Always arrange the data before counting. In the unarranged list 12, 7, 15, 9, 18, 11, 14 the 4th value is 9, but 9 is not the median.
Median of a Discrete Series
In a discrete series the values are already in order and each value carries a frequency. Of the class 8 students, 3 scored 17, 4 scored 18, 8 scored 22, 10 scored 26, 7 scored 30 and 5 scored 32. Writing out all 37 marks one by one would be slow, so we count with cumulative frequency instead.
Cumulative frequency (\( cf \)): the running total of frequencies up to and including a value or class, found by adding each frequency to all the frequencies before it.
In the table below, the cumulative frequency of 26 marks is 25. This means 25 students scored 26 or less. Since the row before it has a \( cf \) of 15, the 16th to 25th students in order all scored exactly 26.
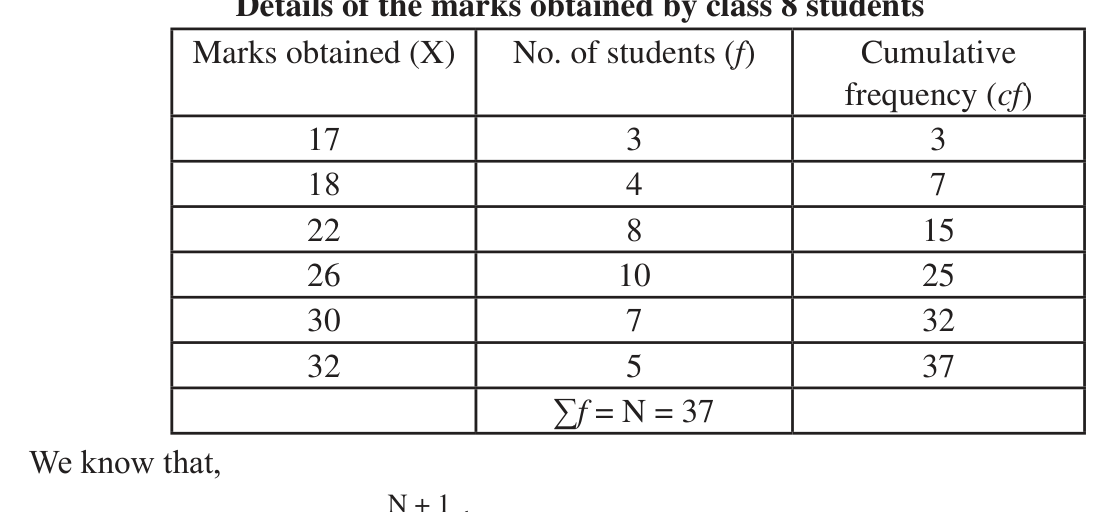
Step 1: Adding all the frequencies to get the total:
\[ N = \sum f = 37 \]
Step 2: Finding the position of the median:
\[ \frac{N+1}{2} = \frac{37+1}{2} = 19 \]
Step 3: Looking down the \( cf \) column for the first value that is 19 or more. The \( cf \) of 15 at 22 marks covers only the first 15 students, and the \( cf \) of 25 at 26 marks covers the 16th to the 25th, so the 19th student's mark is:
\[ M_d = 26 \]
19 is the position of the median, not the median. The median is the mark found at that position, which is 26.
Median of a Continuous Series
Once data is grouped into classes such as 0-8 and 8-16, we no longer see the individual values, only how many fall in each class. So the median cannot be read off directly. It is estimated by assuming that the values inside a class are spread evenly from its lower limit to its upper limit.
In a continuous series the position of the median is taken as the \( \frac{N}{2} \)th item, not the \( \frac{N+1}{2} \)th. Here we are looking for the point with half of the total frequency on each side, and half of \( N \) is exactly \( \frac{N}{2} \).
Less than cumulative frequency: the number of items that are less than the upper limit of each class.
Median class: the class interval that contains the \( \frac{N}{2} \)th item, that is, the first class whose less than cumulative frequency is equal to or greater than \( \frac{N}{2} \).
The median of a continuous series is found in four stages:
- Make a less than cumulative frequency table, counting the items below the upper limit of each class.
- Find the position of the median, the \( \frac{N}{2} \)th item.
- Find the median class, the class that holds that item.
- Put the values into the median formula below.
\[ M_d = L + \dfrac{\frac{N}{2} - cf}{f} \times h \]
where
- \( L \) = lower limit of the median class
- \( N \) = total number of data, the sum of all frequencies
- \( cf \) = cumulative frequency of the class preceding the median class
- \( f \) = frequency of the median class
- \( h \) = length (width) of the class interval
Each part of the formula has a meaning. The \( cf \) items before the median class have already been counted, so \( \frac{N}{2} - cf \) tells us how many more items we must go into the median class. Dividing by \( f \) gives the fraction of the class that is, and multiplying by \( h \) turns that fraction into a distance along the class. Adding this distance to \( L \) gives the median.
The \( cf \) in the formula belongs to the class before the median class, not to the median class itself. Using the median class's own \( cf \) gives an answer smaller than \( L \), which cannot be right.
Worked Example: Marks in Classes of Width 8
The marks of 80 students are grouped in classes of width 8. Make a less than cumulative frequency table and find the median.
| Marks obtained (X) | No. of students (f) | Marks | Less than cumulative frequency (cf) |
| 0-8 | 6 | Less than 8 | 6 |
| 8-16 | 10 | Less than 16 | 6 + 10 = 16 |
| 16-24 | 16 | Less than 24 | 16 + 16 = 32 |
| 24-32 | 18 | Less than 32 | 32 + 18 = 50 |
| 32-40 | 12 | Less than 40 | 50 + 12 = 62 |
| 40-48 | 10 | Less than 48 | 62 + 10 = 72 |
| 48-56 | 8 | Less than 56 | 72 + 8 = 80 |
| N = 80 |
Step 1: Reading the total from the last cumulative frequency:
\[ N = 80 \]
Step 2: Finding the position of the median:
\[ \frac{N}{2} = \frac{80}{2} = 40 \]
Step 3: Locating the median class. 32 students scored less than 24 and 50 scored less than 32, so the 40th item lies in the class 24-32. From this class \( L = 24 \), \( f = 18 \) and \( h = 32 - 24 = 8 \), and the class before it has \( cf = 32 \).
Step 4: Substituting these values into the formula:
\[ M_d = 24 + \dfrac{40 - 32}{18} \times 8 \]
Step 5: Subtracting on the top and multiplying by 8:
\[ M_d = 24 + \dfrac{64}{18} \]
Step 6: Dividing and adding:
\[ M_d = 24 + 3.56 = 27.56 \]
The median mark is 27.56. Roughly half of the 80 students scored below 27.56 and half scored above it.
Worked Example: Weights of Students
The weights of 84 students are grouped in classes 10 kg wide. Find the median weight.
| Weight (kg) | No. of students (f) | Less than cumulative frequency (cf) |
| 20-30 | 16 | 16 |
| 30-40 | 12 | 16 + 12 = 28 |
| 40-50 | 10 | 28 + 10 = 38 |
| 50-60 | 16 | 38 + 16 = 54 |
| 60-70 | 18 | 54 + 18 = 72 |
| 70-80 | 12 | 72 + 12 = 84 |
| N = 84 |
Step 1: Finding the position of the median with \( N = 84 \):
\[ \frac{N}{2} = \frac{84}{2} = 42 \]
Step 2: Locating the median class. The \( cf \) is 38 up to 50 kg and 54 up to 60 kg, so the 42nd student lies in the class 50-60. Here \( L = 50 \), \( cf = 38 \), \( f = 16 \) and \( h = 60 - 50 = 10 \).
Step 3: Substituting into the formula:
\[ M_d = 50 + \dfrac{42 - 38}{16} \times 10 \]
Step 4: Subtracting on the top and multiplying by 10:
\[ M_d = 50 + \dfrac{40}{16} \]
Step 5: Dividing and adding:
\[ M_d = 50 + 2.5 = 52.5 \]
The median weight of the students is 52.5 kg.
Finding a Missing Frequency
Sometimes the median is known but one frequency is missing. The data below shows for how many days people of a village worked voluntarily on public works. The number of workers in the class 30-60 days is unknown and is written \( y \). The median is 93.6 days. Find \( y \).
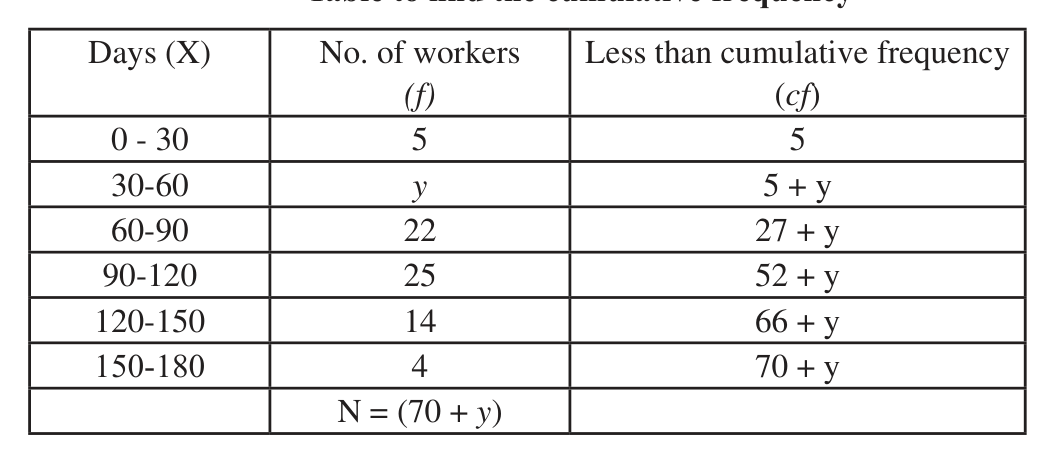
Step 1: Building the cumulative frequencies with \( y \) carried along, the last one gives the total:
\[ N = 70 + y \]
Step 2: Choosing the median class. The median 93.6 lies between 90 and 120, so the median class is 90-120. Here \( L = 90 \), \( cf = 27 + y \), \( f = 25 \) and \( h = 120 - 90 = 30 \).
Step 3: Substituting into the median formula:
\[ 93.6 = 90 + \dfrac{\frac{70+y}{2} - (27+y)}{25} \times 30 \]
Step 4: Subtracting 90 from both sides and writing the top over the common denominator 2:
\[ 3.6 = \dfrac{70 + y - 54 - 2y}{50} \times 30 \]
Step 5: Simplifying the top to \( 16 - y \) and reducing \( \frac{30}{50} \) to \( \frac{3}{5} \):
\[ 3.6 = \dfrac{3(16 - y)}{5} \]
Step 6: Multiplying both sides by 5:
\[ 18 = 48 - 3y \]
Step 7: Moving \( 3y \) to the left and 18 to the right:
\[ 3y = 30 \]
Step 8: Dividing both sides by 3:
\[ y = 10 \]
Check the answer by putting it back. With \( y = 10 \), \( N = 80 \), \( \frac{N}{2} = 40 \) and the \( cf \) before 90-120 is 37, so 90-120 really is the median class, and \( 90 + \frac{40 - 37}{25} \times 30 = 93.6 \).
Class Intervals That Are Not Continuous
The heights of trees in a garden were measured in feet and grouped as 4-6, 7-9, 10-12 and so on. These classes have gaps: no class covers the heights between 6 and 7, so a tree 6.5 ft tall has nowhere to go. The median formula needs classes that join end to end, so the gaps must be closed first.
| Height (ft) | No. of trees |
| 4-6 | 2 |
| 7-9 | 3 |
| 10-12 | 10 |
| 13-15 | 7 |
| 16-18 | 4 |
| 19-21 | 3 |
| 22-24 | 2 |
Correction factor: half the gap between the lower limit of the second class and the upper limit of the first class. To make the classes continuous it is subtracted from every lower limit and added to every upper limit.
\[ \text{C.F.} = \dfrac{l_2 - u_1}{2} \]
Here \( l_2 \) is the lower limit of the second class and \( u_1 \) is the upper limit of the first class.
Step 1: Finding the correction factor from 7, the lower limit of 7-9, and 6, the upper limit of 4-6:
\[ \text{C.F.} = \dfrac{7 - 6}{2} = 0.5 \]
Step 2: Subtracting 0.5 from each lower limit and adding 0.5 to each upper limit. For the class 4-6 the new lower limit is:
\[ 4 - 0.5 = 3.5 \]
and the new upper limit is:
\[ 6 + 0.5 = 6.5 \]
So 4-6 becomes 3.5-6.5, 7-9 becomes 6.5-9.5, and every other class changes in the same way. Now each class ends exactly where the next one begins.
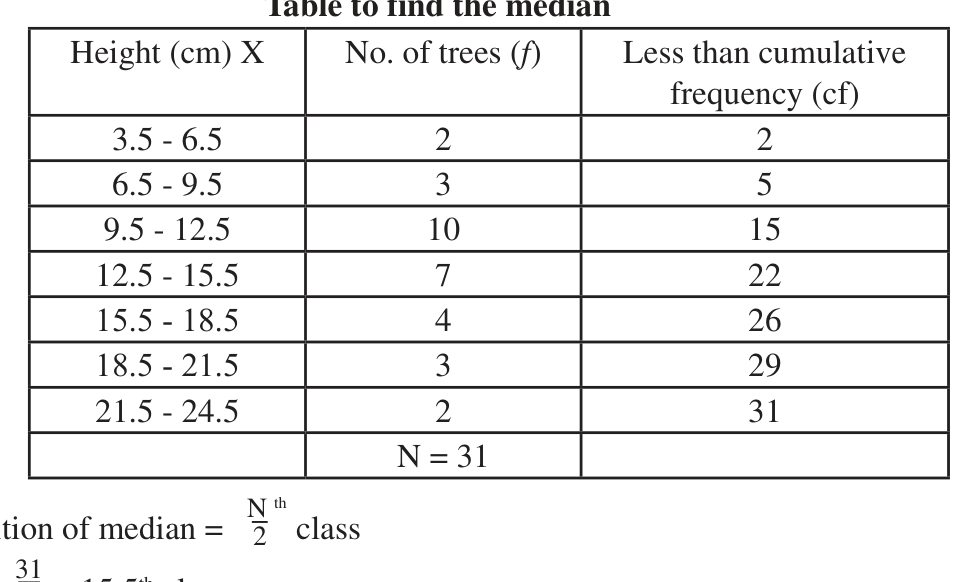
Step 3: Finding the position of the median with \( N = 31 \):
\[ \frac{N}{2} = \frac{31}{2} = 15.5 \]
Step 4: Locating the median class. The \( cf \) is 15 up to 12.5 and 22 up to 15.5, so the 15.5th item lies in 12.5-15.5. Here \( L = 12.5 \), \( cf = 15 \), \( f = 7 \) and \( h = 15.5 - 12.5 = 3 \).
Step 5: Substituting into the formula:
\[ M_d = 12.5 + \dfrac{15.5 - 15}{7} \times 3 \]
Step 6: Subtracting on the top and multiplying by 3:
\[ M_d = 12.5 + \dfrac{1.5}{7} \]
Step 7: Dividing and adding:
\[ M_d = 12.5 + 0.21 = 12.71 \]
The median height of the trees is 12.71 ft.
Once the classes are corrected, take \( L \) and \( h \) from the corrected class. Here \( L \) is 12.5, not 13, and \( h \) is 3, not \( 15 - 13 = 2 \).
Building the Table from Raw Data
Data often arrives as a raw list, and the table has to be built first. From these 24 values, make a frequency distribution table with a class interval of 10 and find the median: 21, 9, 34, 42, 17, 54, 13, 38, 23, 39, 49, 29, 38, 44, 21, 42, 19, 7, 29, 8, 55, 36, 39, 13.
The smallest value is 7 and the largest is 55, so the classes 0-10, 10-20 and so on up to 50-60 cover everything. Go through the list once, drawing a tally bar in the class of each value. Every fifth bar is drawn across the four before it, which makes counting easy. A value on a class boundary, such as 20, goes in the class that starts with it, 20-30.
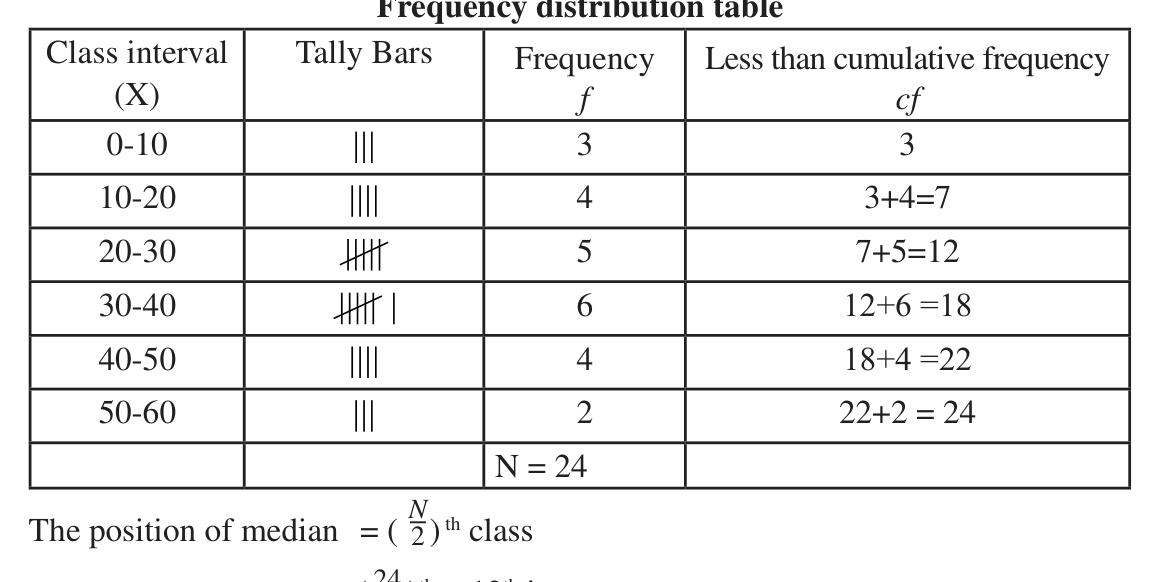
Step 1: Finding the position of the median from the total \( N = 24 \):
\[ \frac{N}{2} = \frac{24}{2} = 12 \]
Step 2: Locating the median class. The \( cf \) is 7 up to 20 and 12 up to 30, so the 12th item lies in 20-30. Here \( L = 20 \), \( cf = 7 \), \( f = 5 \) and \( h = 30 - 20 = 10 \).
Step 3: Substituting into the formula:
\[ M_d = 20 + \dfrac{12 - 7}{5} \times 10 \]
Step 4: Since \( \frac{5}{5} = 1 \), multiplying by 10 and adding:
\[ M_d = 20 + 10 = 30 \]
The median of the data is 30.
Less Than Tables and Open-Ended Classes
Some tables give the less than cumulative frequency directly, such as the number of students scoring less than 10, less than 20 and so on. To use the median formula, first recover the frequency of each class by subtracting each \( cf \) from the next one. For example, the marks of 40 students:
| Marks | Given cf | Class | Frequency (f) |
| Less than 10 | 5 | 0-10 | 5 |
| Less than 20 | 12 | 10-20 | 12 - 5 = 7 |
| Less than 30 | 25 | 20-30 | 25 - 12 = 13 |
| Less than 40 | 36 | 30-40 | 36 - 25 = 11 |
| Less than 50 | 40 | 40-50 | 40 - 36 = 4 |
Step 1: Finding the position of the median with \( N = 40 \):
\[ \frac{N}{2} = \frac{40}{2} = 20 \]
Step 2: 12 students scored less than 20 and 25 scored less than 30, so the median class is 20-30. Here \( L = 20 \), \( cf = 12 \), \( f = 13 \) and \( h = 10 \).
Step 3: Substituting into the formula:
\[ M_d = 20 + \dfrac{20 - 12}{13} \times 10 \]
Step 4: Subtracting on the top and multiplying by 10:
\[ M_d = 20 + \dfrac{80}{13} \]
Step 5: Dividing and adding:
\[ M_d = 20 + 6.15 = 26.15 \]
A table may also begin with 'less than 100' or end with 'more than 500'. Such classes are called open-ended. Give each one the same width as its neighbour: 'less than 100' next to 100-200 is treated as 0-100, and 'more than 500' next to 400-500 as 500-600. The median usually falls in a middle class, so the formula still works.
The full lesson is waiting for you
The notes are free to read in full. A free account opens the rest of the practice, and tracks your progress and confidence score for every subject. Presentations and videos need approval from Learn Yeti.