Quartiles: Cutting Data into Four Equal Parts
When the items of a data set are arranged from the smallest to the largest, the median is the value in the exact middle. It cuts the data into two equal halves. Quartiles cut it more finely. They are three values that divide the arranged data into four equal parts, so each part holds one quarter of all the items. The three quartiles are written \( Q_1 \), \( Q_2 \) and \( Q_3 \), and are read as Q one, Q two and Q three.
Quartiles are the three values that divide a set of data, arranged in order, into four equal parts. They are written \( Q_1 \), \( Q_2 \) and \( Q_3 \).
The first quartile \( Q_1 \) is the value below which one quarter (25%) of the items lie. It is also called the lower quartile.
The second quartile \( Q_2 \) is the value below which half (50%) of the items lie. It is the same as the median.
The third quartile \( Q_3 \) is the value below which three quarters (75%) of the items lie. It is also called the upper quartile.
Seeing Quartiles on a Stick
A stick makes the idea easy to see. Take four sticks, each 64 cm long, and lay them one under another with their left ends at the 0 mark. Now cut them in different ways.
- Cut the first stick into 4 equal pieces. Each piece is \( 64 \div 4 = 16 \) cm long, so the first cut falls at 16 cm.
- Cut the second stick into 2 equal pieces. Each piece is 32 cm long, so the cut falls at 32 cm, the middle of the stick.
- Cut the third stick so that 3 of its 4 equal parts stay together on one side and 1 part is on the other. The cut falls at \( 3 \times 16 = 48 \) cm.
- Leave the fourth stick whole, so the others can be compared with it.
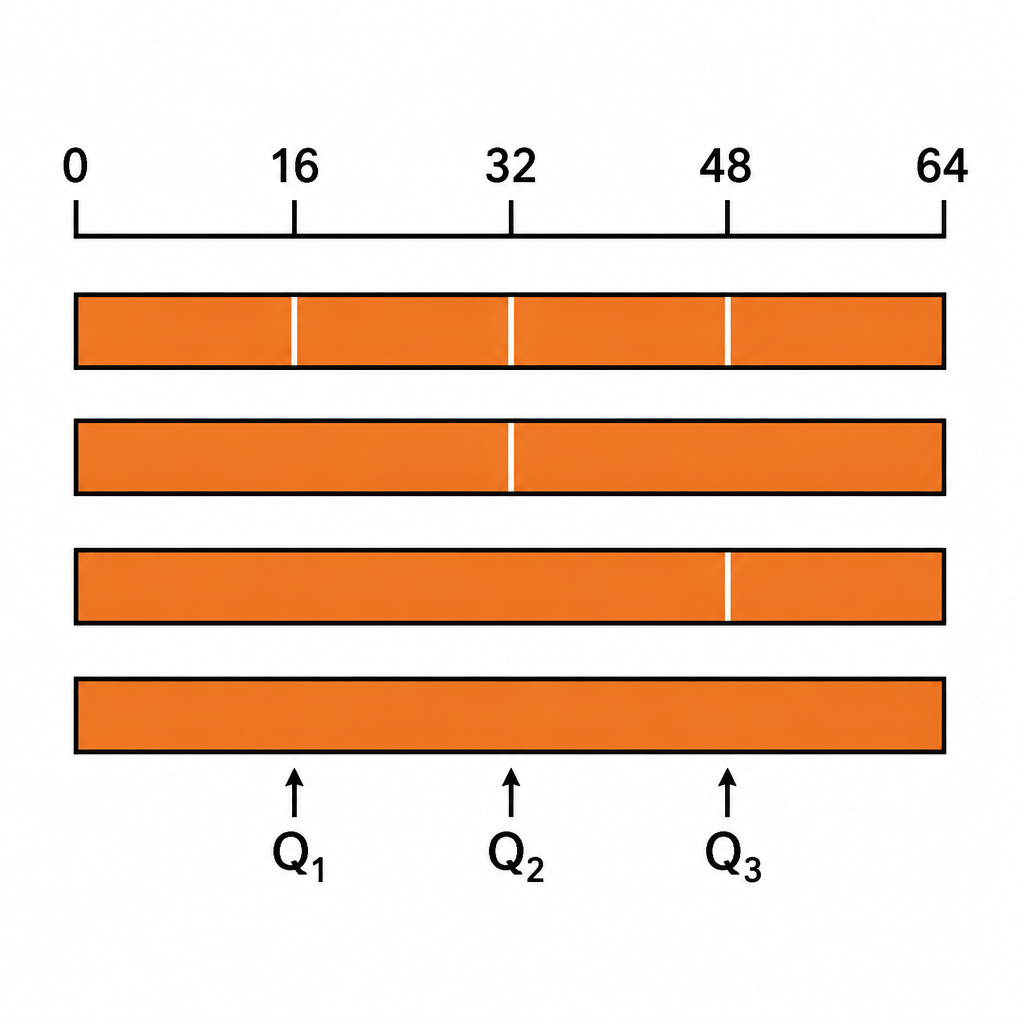
The cut at 16 cm has one quarter of the stick to its left. That point is the first quartile, \( Q_1 = 16 \). The cut at 32 cm has half of the stick on each side, so it is the second quartile, \( Q_2 = 32 \), which is also the median. The cut at 48 cm has three quarters of the stick to its left, so it is the third quartile, \( Q_3 = 48 \).
\( Q_1 \) lies one quarter of the way along, \( Q_2 \) half of the way and \( Q_3 \) three quarters of the way. With data we do exactly the same thing, except that we count items instead of centimetres.
Quartiles of an Individual Series
In an individual series every item is written out separately. To find the quartiles, first arrange the items in ascending order and count them. If there are \( N \) items, the quartiles are found at these positions:
\[ Q_1 = \left(\frac{N+1}{4}\right)^{\text{th}} \text{ item} \]
\[ Q_3 = \left(\frac{3(N+1)}{4}\right)^{\text{th}} \text{ item} \]
For example, seven students scored these marks out of 20 in a quiz: 12, 7, 15, 9, 20, 11, 18. Let us find the first and third quartiles.
Step 1: Arranging the marks in ascending order:
\[ 7,\ 9,\ 11,\ 12,\ 15,\ 18,\ 20 \]
Step 2: There are 7 marks, so \( N = 7 \). Finding the position of \( Q_1 \):
\[ \frac{N+1}{4} = \frac{7+1}{4} = 2 \]
Step 3: The 2nd item in the arranged list is 9, so the first quartile is:
\[ Q_1 = 9 \]
Step 4: Finding the position of \( Q_3 \):
\[ \frac{3(N+1)}{4} = \frac{3 \times 8}{4} = 6 \]
Step 5: The 6th item in the arranged list is 18, so the third quartile is:
\[ Q_3 = 18 \]
The middle item, the 4th one, is 12, and that is the median \( Q_2 \). So the three quartiles of these marks are 9, 12 and 18.
Quartiles of a Discrete Series
In a discrete series each value is written once, with its frequency beside it, which is the number of times that value occurs. The positions of the quartiles are the same as in an individual series, \( \frac{N+1}{4} \) and \( \frac{3(N+1)}{4} \), where \( N \) is now the sum of all the frequencies. To see which value sits at a position, add a cumulative frequency (cf) column. Each cf tells you how many items there are up to and including that row. Go down the cf column and stop at the first cf that is equal to or greater than the position. The value in that row is the quartile.
The cumulative frequency (cf) of a value or a class is its own frequency added to all the frequencies before it. The last cf in a table always equals \( N \), the total number of items.
Example 1: Quartiles of Workers' Ages
The ages of 59 workers in a factory are shown in the table below. Find the first quartile and the third quartile.
| Age (years) | Number of workers |
| 20 | 2 |
| 25 | 8 |
| 28 | 12 |
| 30 | 10 |
| 32 | 14 |
| 35 | 7 |
| 42 | 5 |
| 46 | 1 |
Step 1: Adding a cumulative frequency column. The last cf gives \( N = 59 \):
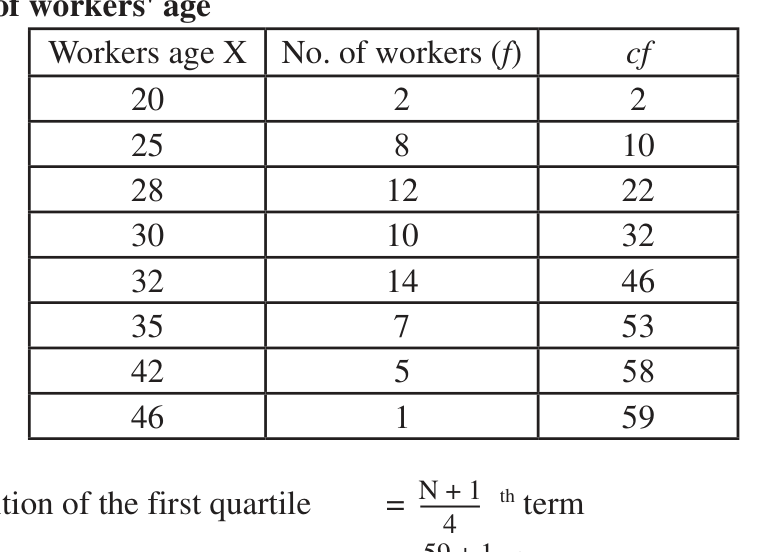
Step 2: Finding the position of \( Q_1 \):
\[ \frac{N+1}{4} = \frac{59+1}{4} = \frac{60}{4} = 15 \]
Step 3: Locating the 15th item. The cf is 10 at age 25 and 22 at age 28, so the 11th to the 22nd workers are all 28 years old. The 15th worker is one of them, so:
\[ Q_1 = 28 \text{ years} \]
Step 4: Finding the position of \( Q_3 \):
\[ \frac{3(N+1)}{4} = \frac{3 \times 60}{4} = \frac{180}{4} = 45 \]
Step 5: Locating the 45th item. The cf is 32 at age 30 and 46 at age 32, so the 33rd to the 46th workers are all 32 years old. The 45th worker is one of them, so:
\[ Q_3 = 32 \text{ years} \]
Quartiles of a Continuous Series
In a continuous series the data is grouped into class intervals such as 30-40, and we know only how many items fall in each class, not their exact values. So a quartile cannot be read straight from the table. Instead we find the class it lies in, called the quartile class, and use a formula that places the quartile inside that class. In a continuous series the positions are \( \frac{N}{4} \) for \( Q_1 \) and \( \frac{3N}{4} \) for \( Q_3 \). No 1 is added to \( N \) here.
The quartile class is the first class whose less than cumulative frequency is equal to or greater than the position of the quartile.
The method has five steps:
- Make the less than cumulative frequency column. Its last entry is the total frequency.
- Find the position of the quartile: one quarter of the total frequency for the first quartile, three quarters of it for the third quartile.
- Find the quartile class. It is the first class whose cumulative frequency is equal to or greater than that position.
- From the quartile class, read its lower limit, its frequency and its width, and the cumulative frequency of the class just before it.
- Put these values into the formula and simplify.
The formulas for the first and third quartiles are:
\[ Q_1 = L + \frac{\frac{N}{4} - cf}{f} \times h \]
\[ Q_3 = L + \frac{\frac{3N}{4} - cf}{f} \times h \]
Here the letters stand for these, all taken from the quartile class being used:
- \( L \) = lower limit of the quartile class
- \( N \) = total number of items, the sum of all the frequencies
- \( cf \) = cumulative frequency of the class just before the quartile class
- \( f \) = frequency of the quartile class
- \( h \) = length (width) of the class interval
The second quartile is the median. Its position is \( \frac{N}{2} \), and its formula has the same shape:
\[ Q_2 = L + \frac{\frac{N}{2} - cf}{f} \times h \]
For an individual or a discrete series the positions are \( \frac{N+1}{4} \) and \( \frac{3(N+1)}{4} \). For a continuous series they are \( \frac{N}{4} \) and \( \frac{3N}{4} \). Adding 1 in a continuous series can put you in the wrong class and always changes the answer.
The \( cf \) in the formula belongs to the class BEFORE the quartile class, not to the quartile class itself. The quartile class's own cf is used only to find which class it is.
Example 2: First and Third Quartiles of Marks
The marks obtained in Mathematics by 60 students are given in the table below. Find \( Q_1 \) and \( Q_3 \).
| Marks obtained | Number of students |
| 10-20 | 2 |
| 20-30 | 8 |
| 30-40 | 15 |
| 40-50 | 14 |
| 50-60 | 10 |
| 60-70 | 8 |
| 70-80 | 3 |
Step 1: Making the cumulative frequency column. The total is \( N = 60 \):
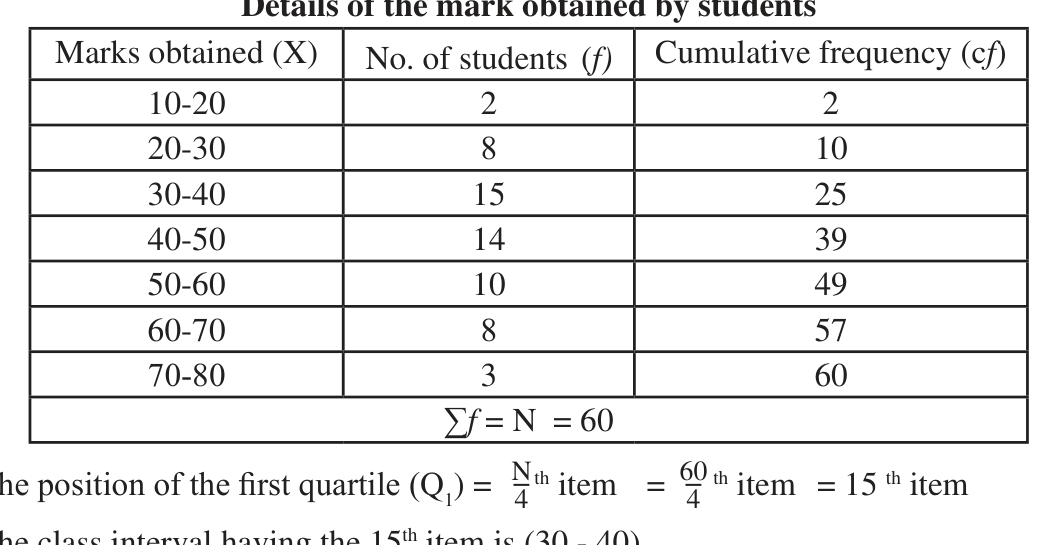
Step 2: Finding the position of \( Q_1 \):
\[ \frac{N}{4} = \frac{60}{4} = 15 \]
Step 3: Finding the \( Q_1 \) class. The cf of the class 20-30 is 10, which is less than 15. The next cf, 25 for the class 30-40, is the first one equal to or greater than 15. So the \( Q_1 \) class is 30-40, and from it:
\[ L = 30,\ cf = 10,\ f = 15,\ h = 10 \]
Step 4: Substituting into the formula for \( Q_1 \):
\[ Q_1 = 30 + \frac{15 - 10}{15} \times 10 \]
Step 5: Subtracting on top and multiplying by 10:
\[ Q_1 = 30 + \frac{50}{15} \]
Step 6: Dividing and adding. Since \( 50 \div 15 \approx 3.33 \):
\[ Q_1 \approx 30 + 3.33 = 33.33 \]
Step 7: Finding the position of \( Q_3 \):
\[ \frac{3N}{4} = \frac{3 \times 60}{4} = 45 \]
Step 8: Finding the \( Q_3 \) class. The cf of 40-50 is 39, which is less than 45, and the cf of 50-60 is 49, the first one equal to or greater than 45. So the \( Q_3 \) class is 50-60, and from it:
\[ L = 50,\ cf = 39,\ f = 10,\ h = 10 \]
Step 9: Substituting into the formula for \( Q_3 \):
\[ Q_3 = 50 + \frac{45 - 39}{10} \times 10 \]
Step 10: Simplifying the fraction and adding:
\[ Q_3 = 50 + \frac{60}{10} = 50 + 6 = 56 \]
So \( Q_1 \approx 33.33 \) marks and \( Q_3 = 56 \) marks. One quarter of the students scored below about 33.33 marks, and three quarters scored below 56 marks.
Example 3: Finding All Three Quartiles
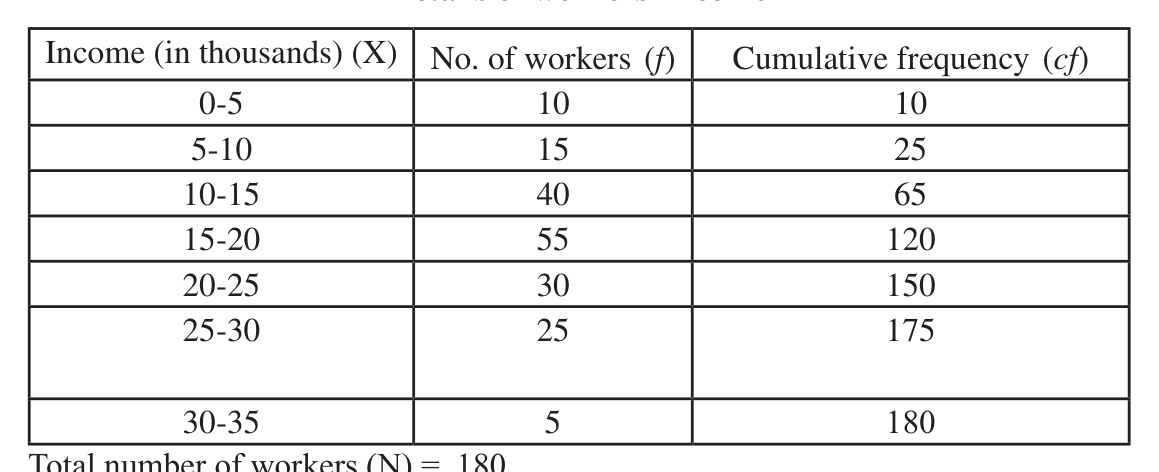
The incomes of 180 workers, in thousands of rupees, are given below. Find \( Q_1 \), \( Q_2 \) and \( Q_3 \).
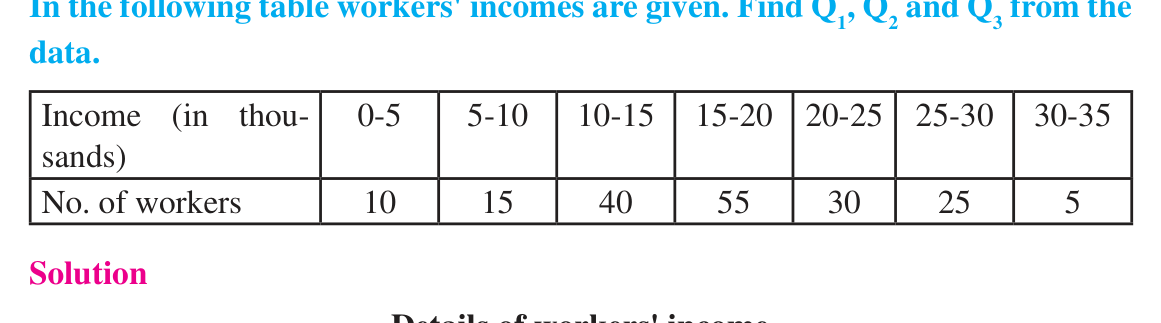
Step 1: Making the cumulative frequency column. The total is \( N = 180 \):
Step 2: Finding the position of \( Q_1 \):
\[ \frac{N}{4} = \frac{180}{4} = 45 \]
Step 3: Finding the \( Q_1 \) class. The cf 25 of the class 5-10 is less than 45, and the cf 65 of the class 10-15 is the first one equal to or greater than 45. So the \( Q_1 \) class is 10-15, and from it:
\[ L = 10,\ cf = 25,\ f = 40,\ h = 5 \]
Step 4: Substituting into the formula for \( Q_1 \):
\[ Q_1 = 10 + \frac{45 - 25}{40} \times 5 \]
Step 5: Simplifying the fraction and adding:
\[ Q_1 = 10 + \frac{100}{40} = 10 + 2.5 = 12.5 \]
Step 6: Finding the position of \( Q_2 \), the median:
\[ \frac{N}{2} = \frac{180}{2} = 90 \]
Step 7: Finding the \( Q_2 \) class. The cf 65 of 10-15 is less than 90, and the cf 120 of 15-20 is the first one equal to or greater than 90. So the \( Q_2 \) class is 15-20, and from it:
\[ L = 15,\ cf = 65,\ f = 55,\ h = 5 \]
Step 8: Substituting into the formula for \( Q_2 \):
\[ Q_2 = 15 + \frac{90 - 65}{55} \times 5 \]
Step 9: Simplifying. Since \( \frac{25 \times 5}{55} = \frac{25}{11} \approx 2.27 \):
\[ Q_2 \approx 15 + 2.27 = 17.27 \]
Step 10: Finding the position of \( Q_3 \):
\[ \frac{3N}{4} = \frac{3 \times 180}{4} = 135 \]
Step 11: Finding the \( Q_3 \) class. The cf 120 of 15-20 is less than 135, and the cf 150 of 20-25 is the first one equal to or greater than 135. So the \( Q_3 \) class is 20-25, and from it:
\[ L = 20,\ cf = 120,\ f = 30,\ h = 5 \]
Step 12: Substituting into the formula for \( Q_3 \):
\[ Q_3 = 20 + \frac{135 - 120}{30} \times 5 \]
Step 13: Simplifying the fraction and adding:
\[ Q_3 = 20 + \frac{75}{30} = 20 + 2.5 = 22.5 \]
The incomes are in thousands of rupees, so \( Q_1 \) is Rs 12,500, the median \( Q_2 \) is about Rs 17,270 and \( Q_3 \) is Rs 22,500.
Example 4: Finding a Missing Frequency
The amounts students spent on tiffin in one week are grouped below. The number of students in one class is unknown and is written \( p \). The upper quartile of the data is Rs 460. Find the value of \( p \).
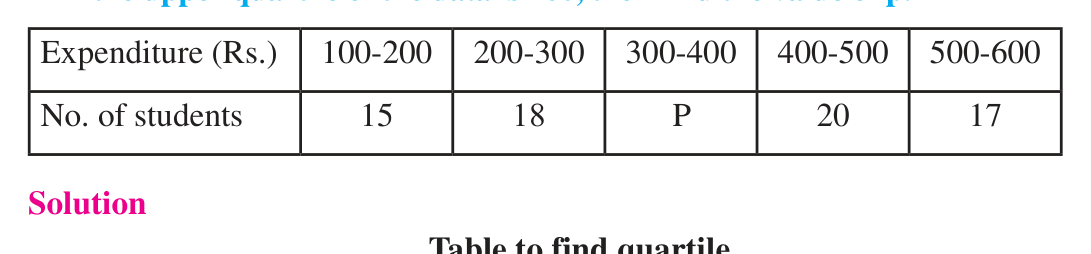
Step 1: Making the cumulative frequency column, carrying \( p \) along from the row where it first appears:
| Expenditure (Rs) | No. of students (f) | cf |
| 100-200 | 15 | 15 |
| 200-300 | 18 | 33 |
| 300-400 | p | 33 + p |
| 400-500 | 20 | 53 + p |
| 500-600 | 17 | 70 + p |
\[ N = 70 + p \]
Step 2: Finding the \( Q_3 \) class. The cf column cannot be used here because it contains \( p \). But the upper quartile is 460, and 460 lies between 400 and 500, so the \( Q_3 \) class must be 400-500. From it:
\[ L = 400,\ cf = 33 + p,\ f = 20,\ h = 100 \]
Step 3: Writing \( \frac{3N}{4} \) in terms of \( p \):
\[ \frac{3N}{4} = \frac{3(70 + p)}{4} = \frac{210 + 3p}{4} \]
Step 4: Substituting everything into the formula for \( Q_3 \):
\[ 460 = 400 + \frac{\frac{210 + 3p}{4} - (33 + p)}{20} \times 100 \]
Step 5: Subtracting 400 from both sides and writing the top as a single fraction. Since \( 33 + p = \frac{132 + 4p}{4} \), the top becomes \( \frac{210 + 3p - 132 - 4p}{4} = \frac{78 - p}{4} \), which gives:
\[ 60 = \frac{78 - p}{4 \times 20} \times 100 \]
Step 6: Cancelling, since \( 100 \div 20 = 5 \):
\[ 60 = \frac{78 - p}{4} \times 5 \]
Step 7: Multiplying both sides by 4 and dividing both sides by 5:
\[ 78 - p = \frac{60 \times 4}{5} = 48 \]
Step 8: Solving for \( p \):
\[ p = 78 - 48 = 30 \]
Step 9: Checking the answer. With \( p = 30 \), \( N = 100 \) and \( \frac{3N}{4} = 75 \). The cf before 400-500 is \( 33 + 30 = 63 \) and the cf of 400-500 is 83, so the 75th item really is in 400-500. Then:
\[ Q_3 = 400 + \frac{75 - 63}{20} \times 100 \]
\[ Q_3 = 400 + 60 = 460 \]
This matches the given upper quartile, so the missing frequency is \( p = 30 \).
When a frequency is missing, the cf column contains the unknown, so it cannot tell you the quartile class. Use the given quartile instead: the class it lies in is the quartile class. Then check your answer by working the quartile out again.
Getting the Table Ready
The formula needs a continuous series with a frequency for each class. Sometimes the data comes in another shape, and it has to be put right first.
- Raw data: group the values into classes of the width you are told, and count how many fall in each class. A value on a boundary goes into the class that starts with it, so 30 goes into 30-40, not 20-30.
- A less than table, such as 'less than 130: 5' and 'less than 135: 11': subtract each total from the next one to get the frequencies. The class 130-135 has \( 11 - 5 = 6 \) items.
- Inclusive classes, such as 110-119 and 120-129: there is a gap of 1 between 119 and 120. Take 0.5 off every lower limit and add 0.5 to every upper limit, giving 109.5-119.5 and 119.5-129.5. Use these new limits for \( L \).
- Open classes, such as 'less than 100' or 'more than 500': they can stay as they are, as long as the quartile class is not one of them.
What the Quartiles Tell Us
The three quartiles divide the items into four groups of equal size. One quarter of the items lie below \( Q_1 \), one quarter between \( Q_1 \) and \( Q_2 \), one quarter between \( Q_2 \) and \( Q_3 \), and one quarter above \( Q_3 \). So the middle half of the data lies between \( Q_1 \) and \( Q_3 \). In the income example, half of the 180 workers, which is 90 workers, earn between Rs 12,500 and Rs 22,500.
\( Q_1 \) is also called the lower quartile and \( Q_3 \) the upper quartile. A question that gives you the upper quartile is giving you \( Q_3 \).
The full lesson is waiting for you
The notes are free to read in full. A free account opens the rest of the practice, and tracks your progress and confidence score for every subject. Presentations and videos need approval from Learn Yeti.