Two Ways to Get Somewhere: the Snake and the Frog
Watch a snake move across the ground. Its body slides forward and stays in touch with the ground the whole time. It never leaves the ground and lands again further on. If you could trace its path with chalk, you would get one long unbroken line.
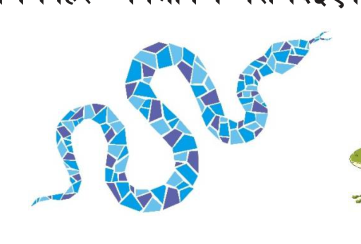
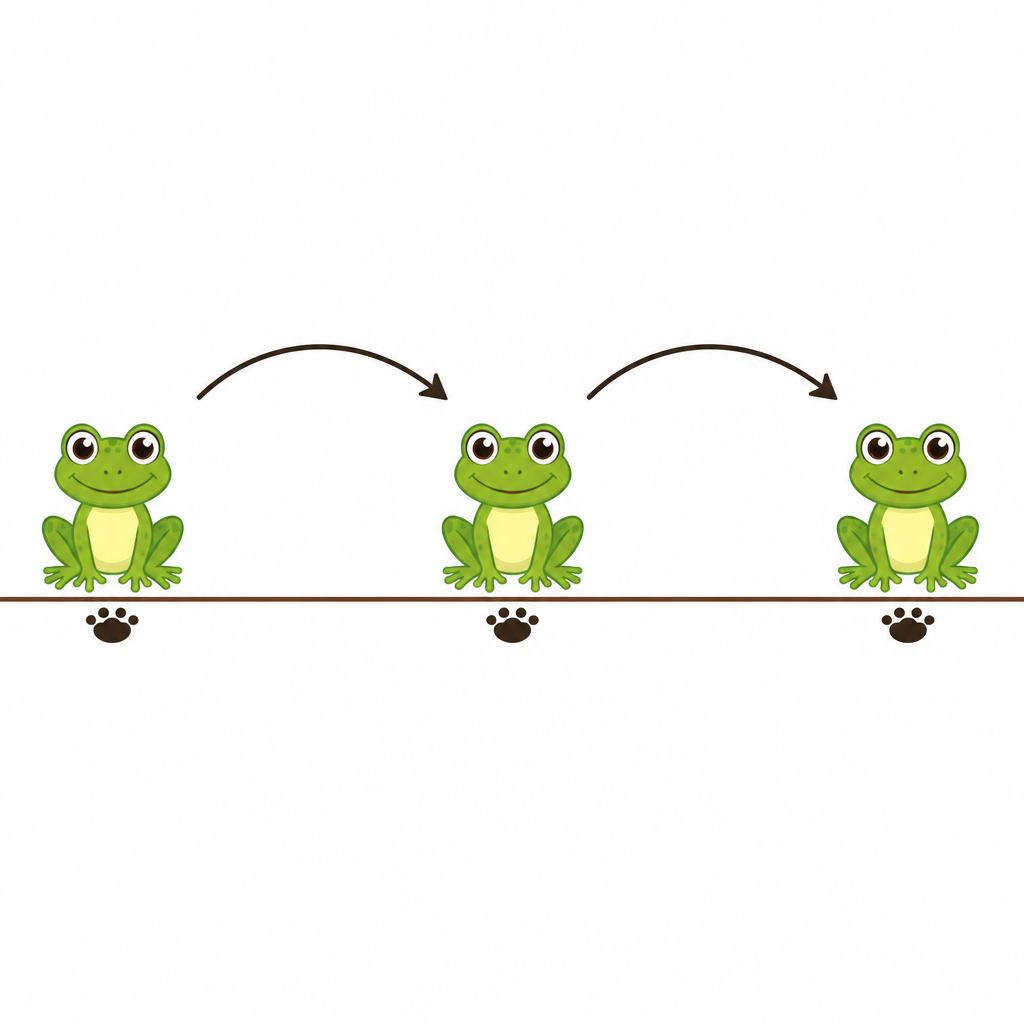
Now watch a frog. It pushes off, flies through the air and lands a little way ahead. Then it does the same again. The frog touches the ground only at its landing spots, and the ground between two landing spots is never touched at all. Trace its path on the ground and you get a row of separate marks with empty gaps between them.
These two animals carry the whole idea of this lesson. The snake's path is continuous, because it goes on without a break. The frog's path is discontinuous, because it is made of separate pieces with gaps between them.
Continuous: something is continuous when it goes on without any break, gap or jump. Another word for it is uninterrupted.
Discontinuous: something is discontinuous when it has at least one break, gap or jump in it.
Figures Drawn Without Lifting the Pen
Here is a quick test you can do with pen and paper. Try to draw each of the three figures below. Start anywhere, and try to finish the whole figure without lifting the pen from the paper even once.
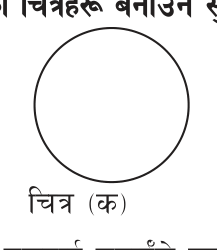
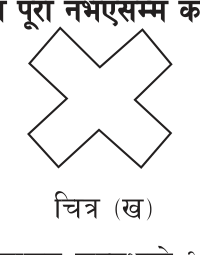
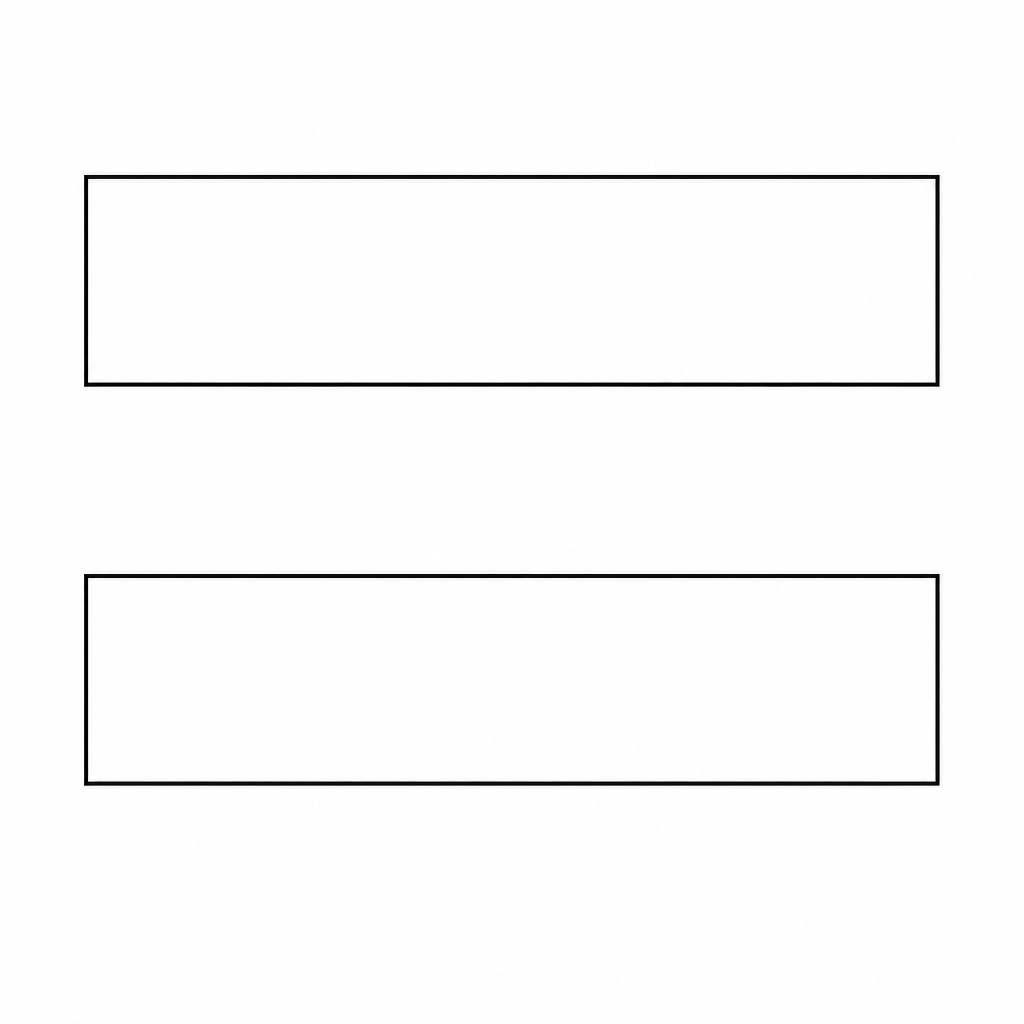
The circle is easy. The cross looks harder, but its outline is a single closed line of twelve straight edges, so the pen can go round the whole of it without leaving the paper. The two rectangles are different. However cleverly you try, when the first rectangle is complete the pen has to be lifted and carried across the empty space before the second one can begin.
Mathematicians use exactly this test. The circle and the cross are continuous figures. The pair of rectangles is a discontinuous figure, because at one point the pen has to jump.
Continuous figure: a figure is continuous if, while drawing it from start to finish, the tip of the pen never has to leave the paper.
Discontinuous figure: a figure is discontinuous if, after reaching some point, the pen has to be lifted and taken to another place to carry on drawing.
The pen test: if you never had to lift the pen, the figure is continuous. If you had to lift it even once, there is a break, and the figure is discontinuous.
Gaps Between Natural Numbers, Whole Numbers and Integers
Now put numbers on a line. The number line below has the integers from -5 to 5 marked on it, together with some other numbers that sit between them: -4.25, \( -\frac{7}{2} \), -1.75, \( -\frac{1}{2} \), \( \frac{1}{2} \), 1.5, e = 2.72 and \( \pi = 3.14 \).
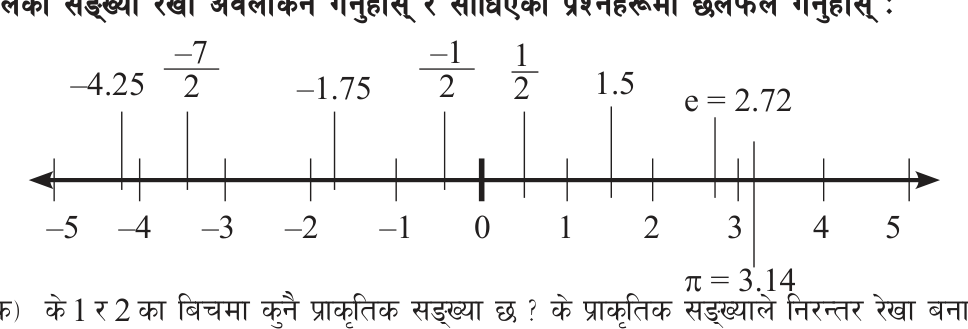
Ask three questions about this line.
- (a) Is there a natural number between 1 and 2? No. The natural numbers are 1, 2, 3, 4 and so on, and the next one after 1 is 2. Nothing in the set lies between them.
- (b) Is there a whole number between 3 and 4? No. The whole numbers are 0, 1, 2, 3 and so on, and the next one after 3 is 4.
- (c) Is there an integer between -1 and 0? No. The integers are ..., -2, -1, 0, 1, 2, ..., and the next one after -1 is 0.

So if you move from 1 to 2, from 3 to 4, or from -1 to 0 using only these numbers, you have to jump over an empty stretch of the line. Like the frog, you land on 1, jump, and land on 2. Every point in between is skipped. That empty stretch is a gap. This is why the natural numbers, the whole numbers and the integers do not make a continuous line. Drawn on a number line, each of these sets is a row of separate dots.
The Real Number Line Has No Gaps
Real numbers are different. Between 1 and 2 there are 1.5, 1.25, 1.001, \( \sqrt{2} = 1.414\ldots \) and endlessly many more. Between any two real numbers, however close together they are, there is always another real number. Even numbers like e = 2.72 and \( \pi = 3.14 \), which cannot be written as fractions, have their own exact places on the line.
So when all the real numbers are placed on the number line, no place is left empty. Every point of the line stands for exactly one real number. There is no hole, no gap and no jump anywhere. This is why the real number line is continuous. It behaves like the snake, not like the frog.
Natural numbers, whole numbers and integers do not form a continuous line. Real numbers fill the number line completely, so the real number line is continuous.
This tells you exactly what a stretch of real numbers covers. The real numbers from -2 to +2 are not just -2, -1, 0, 1 and 2. They are every single point of the line from -2 to +2, including -1.5, 0.3, \( \sqrt{3} \) and all the rest. In symbols, the real numbers x from -2 to 2 are written as:
\[ -2 \le x \le 2 \]
The integers from -2 to 2 are only five points: -2, -1, 0, 1 and 2. The real numbers from -2 to 2 are every point of the line from -2 to 2. Do not mix up the two.
Continuous and Stepwise Change in Daily Life
Things around us change in one of two ways. Some change continuously. A plant that grows from 10 cm to 11 cm tall passes through 10.1 cm, 10.5 cm, 10.83 cm and every height in between. It never jumps from one height to the next. The temperature during a day and the distance a bus has travelled change in the same smooth way.
Other things change only in whole steps. The number of students in a class goes from 40 to 41, never to 40.5. The number of coins in your pocket goes up or down one coin at a time. A cricket score goes up by whole runs: 1, 2, 4 or 6 at a time. These changes are discontinuous. Their values are separate, like the frog's landing spots.
If a quantity can take every value in between as it changes, it changes continuously. If it can only take separate values, it changes in steps and is discontinuous.
Reading Continuity from a Graph
A graph is a drawing, so the pen test works on it directly. A curve is continuous over a stretch of x values if you can trace it over that stretch without lifting your pencil. If the curve has a hole, a gap or a jump at some point, it is discontinuous at that point.
Graphs use small marks at the ends of a curve and at its breaks. The whole reading depends on these marks.
| Mark | What it looks like | What it means |
| Filled dot | A solid black dot | This point is on the curve. It is included. |
| Open circle | A small hollow ring | This point is missing. There is a hole in the curve here. |
| Jump | The curve stops and starts again at a different height | The curve is broken at this x value. |
To describe where a curve is continuous, write the x values as an inequality. Use \( \le \) at an end that is a filled dot, because that point is included. Use \( < \) at an end that is an open circle or a break, because that point is left out.
Continuous curve over an interval: a curve is continuous from x = a to x = b when it can be drawn over that whole stretch without lifting the pen, with no hole, gap or jump.
Point of discontinuity: the x value at which a curve is broken by a hole, a gap or a jump.
For a curve to be continuous at x = a, its graph must not be broken at x = a.
Worked Example: Where Is Each Curve Continuous?
For each curve below, find from which point to which point it is continuous, and at which point, if any, it is discontinuous. Each small square on the grid is one unit.
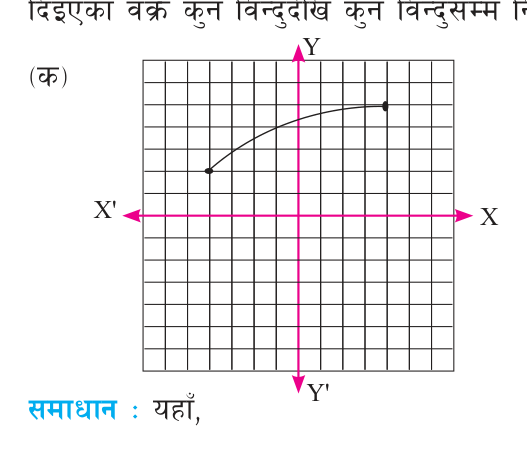
First curve. Step 1: Reading where the curve starts. It begins at a filled dot, so this end is included:
\[ x = -4 \]
Step 2: Reading where the curve ends. It finishes at a filled dot, so this end is included too:
\[ x = 4 \]
Step 3: Tracing from left to right to look for breaks. There is no open circle and no jump, so the pencil never lifts. The curve is continuous over:
\[ -4 \le x \le 4 \]
So the first curve is continuous from x = -4 to x = 4 and has no point of discontinuity.
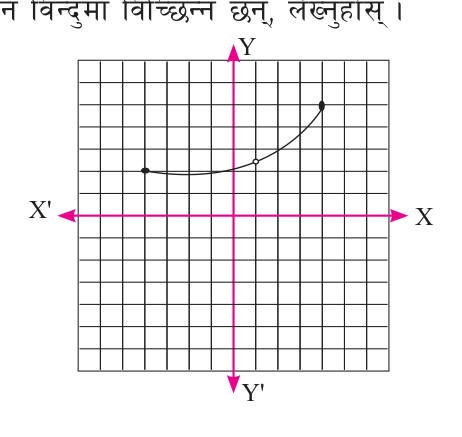
Second curve. Step 1: Reading the two ends. It starts at a filled dot at x = -4 and ends at a filled dot at x = 4, so the curve lies over:
\[ -4 \le x \le 4 \]
Step 2: Finding the break. Above x = 1 there is an open circle. That point is missing, so the curve is broken there. The point of discontinuity is:
\[ x = 1 \]
Step 3: Writing the stretch to the left of the hole. It runs from the filled dot at -4 up to 1, but does not include 1:
\[ -4 \le x < 1 \]
Step 4: Writing the stretch to the right of the hole. It runs from just after 1 up to and including the filled dot at 4:
\[ 1 < x \le 4 \]
So the second curve is discontinuous at x = 1, and continuous on \( -4 \le x < 1 \) and on \( 1 < x \le 4 \).
Never put \( \le \) next to the x value of an open circle. Writing \( -4 \le x \le 1 \) would claim that the point at x = 1 is on the curve, when the hollow ring says it is missing.
More Graphs to Read
The same reading works on any curve. Here are three more, each broken in a different way.
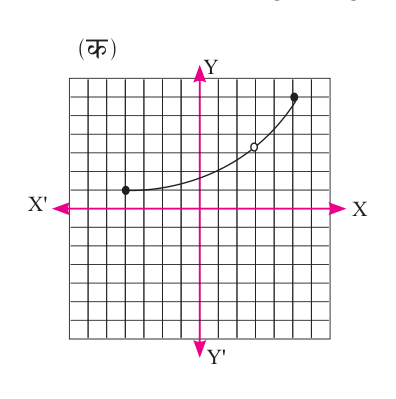
The curve with a hole at x = 3 starts at a filled dot at x = -4 and ends at a filled dot at x = 5. The open circle at x = 3 is a hole. So the curve is discontinuous at \( x = 3 \), and continuous on \( -4 \le x < 3 \) and on \( 3 < x \le 5 \).
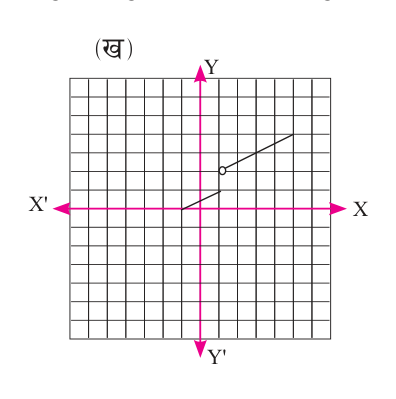
The curve made of two straight pieces rises from x = -1 to x = 1. There it stops, and the next piece begins higher up, at an open circle. To carry on drawing, the pen must jump upward. So the curve is discontinuous at \( x = 1 \), and continuous on \( -1 \le x < 1 \) and on \( 1 < x \le 5 \).
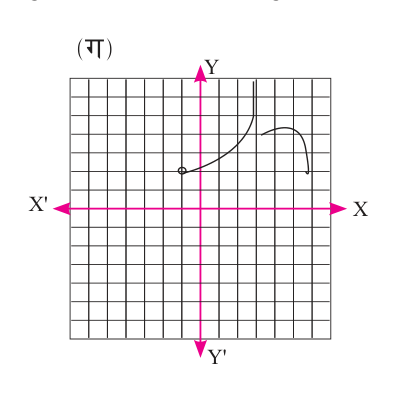
The third curve begins at an open circle at x = -1, so that point is left out. It rises and turns steeply upward close to x = 3, running off the top of the grid. A separate piece of curve starts again to the right of x = 3. The pen cannot get from one piece to the other without being lifted, so the curve is discontinuous at \( x = 3 \). It is continuous on \( -1 < x < 3 \), and the piece on the right is continuous on its own.
Bent Is Not Broken: Three Wires in a House
The wiring of a house shows why the difference between a corner and a break matters. Think of three wires, each drawn as a graph with the distance along the wire, in metres, on the x axis.
- Wire A is straight and is not broken anywhere, so electric current flows through it all the time.
- Wire B has been bent sharply at a right angle at the corner of a room, at x = 3, but it has not been cut inside.
- Wire C has been bitten through by a rat, or has worn out with age, exactly 4 metres along, at x = 4, so the current stops there.
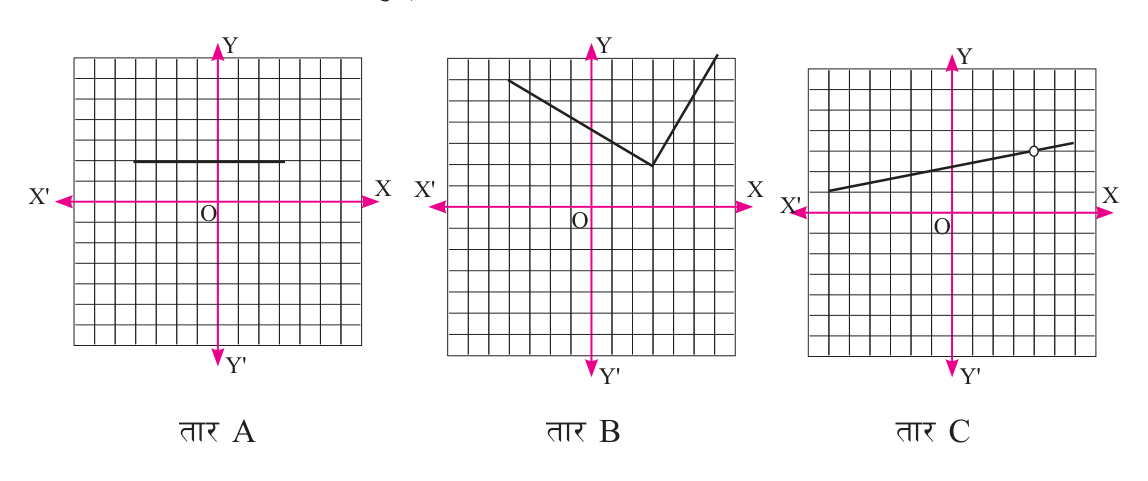
The graph of wire A is a straight unbroken line, so it is continuous. The graph of wire B changes direction suddenly at x = 3 and makes a sharp point, but the two parts meet at the same point. You can trace it without lifting the pen, and current still flows through it, so wire B is continuous at x = 3. The graph of wire C has an open circle at x = 4. The pen must jump over it, and current cannot pass, so wire C is discontinuous at x = 4. That cut is a point of discontinuity.
A sharp corner changes the direction of a curve, not its connection. Continuity is broken only by a hole, a gap or a jump.
The full lesson is waiting for you
The notes are free to read in full. A free account opens the rest of the practice, and tracks your progress and confidence score for every subject. Presentations and videos need approval from Learn Yeti.