Where Linear Inequalities Are Used
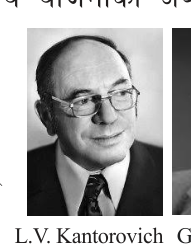
A shopkeeper wants the greatest profit. A factory wants the smallest cost. Both have limits: only so much money, so many workers, so many hours. Linear programming is a method for making the best choice under such limits, and every limit in it is written as a linear inequality. Two mathematicians shaped the method. Leonid Vitalyevich Kantorovich, a Russian mathematician, developed the idea in 1939. George B. Dantzig, an American mathematical economist, developed it further and is called the father of linear programming.

Turning Everyday Statements into Inequalities
Many ordinary sentences describe a limit. Words such as "at most", "at least", "less than" and "more than" tell us that a quantity is not fixed at one value but may lie anywhere on one side of a number. Such a sentence can be written as a mathematical sentence using an inequality sign.
| Words in the statement | Sign | Example |
| less than | \( < \) | \( x < 5 \) |
| more than, greater than | \( > \) | \( x > 5 \) |
| at most, not more than | \( \le \) | \( x \le 5 \) |
| at least, not less than | \( \ge \) | \( x \ge 5 \) |
Here are three statements turned into inequalities. In each one, the first job is to decide what the letter stands for.
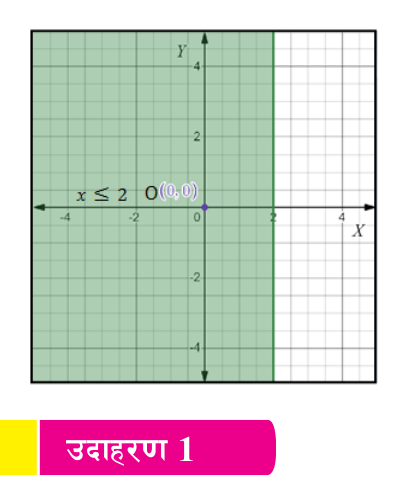
- (a) Suresh takes at most 2 hours to reach school from home. Let \( x \) be the time in hours. "At most 2" means 2 or less, so the statement is \( x \le 2 \).
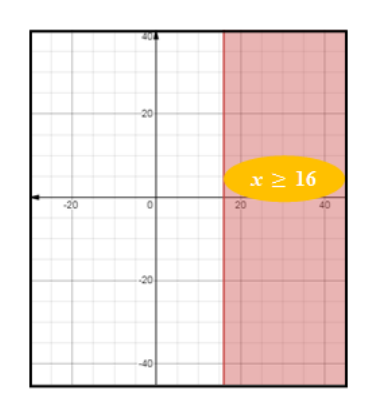
- (b) A Nepali citizen must be at least 16 years old to get citizenship. Let \( x \) be the age in years. "At least 16" means 16 or more, so the statement is \( x \ge 16 \).
- (c) Rupesh has Rs. 750. A pen costs Rs. 15 and a copy costs Rs. 25. Let \( x \) be the number of pens and \( y \) the number of copies he buys. The pens cost \( 15x \) rupees and the copies cost \( 25y \) rupees, and together they cannot cost more than Rs. 750, so the statement is \( 15x + 25y \le 750 \).
Statements (a) and (b) contain only one variable. Statement (c) contains two. In all three, each variable appears only to the power 1 and no two variables are multiplied together. That is what makes them linear.
Linear inequality: a mathematical sentence that uses one of the signs \( < \), \( > \), \( \le \) or \( \ge \), in which every variable has power 1 and no variables are multiplied together.
Linear inequality in one variable: a linear inequality containing only \( x \) or only \( y \), such as \( x \ge 16 \) or \( y < 3 \).
Linear inequality in two variables: a linear inequality of the form \( ax + by < c \) (or with \( > \), \( \le \), \( \ge \)), where \( a \) and \( b \) are not both zero, such as \( 15x + 25y \le 750 \).
\( x^2 + y \le 4 \) and \( xy > 3 \) are inequalities, but they are not linear. In the first a variable is squared, and in the second two variables are multiplied. Their boundaries are curves, not straight lines.
Five Steps for Graphing a Linear Inequality
An equation such as \( x = 2 \) is true only on a line. An inequality such as \( x \le 2 \) is true on a whole region of the plane. Graphing an inequality means finding and shading that region. The same five steps work whether the inequality has one variable or two.
Step 1: Change the inequality into an equation by replacing its sign with \( = \). The line of this equation is the boundary line.
Step 2: Draw the boundary line on the graph. If the sign is \( > \) or \( < \), draw it as a dotted line. If the sign is \( \ge \) or \( \le \), draw it as a solid line.
Step 3: Choose a test point that does not lie on the boundary line and put its coordinates into the inequality. For example, putting \( (0, 0) \) into \( 2x + y \le 5 \) gives:
\[ 0 \le 5 \]
This statement is true.
Step 4: If the test point makes the inequality true, the solution region is the side of the line that contains the test point. If it makes the inequality false, the solution region is the opposite side.
Step 5: Shade the solution region. The shaded region is the graph of the inequality.
Boundary line: the straight line obtained by replacing the inequality sign with \( = \). It splits the plane into two sides.
Test point: any point not on the boundary line whose coordinates are put into the inequality to find out which side is the solution region.
Solution region: the set of all points whose coordinates make the inequality true. On a graph it is shown by shading.
Why does the sign decide the kind of line? With \( \le \) or \( \ge \), a point exactly on the line makes both sides equal, and "equal" is allowed, so the line belongs to the answer and is drawn solid. With \( < \) or \( > \), equality is not allowed, so the line is only a border and is drawn dotted.
| Sign in the inequality | Boundary line | Points on the line included? |
| \( \le \) or \( \ge \) | solid line | Yes |
| \( < \) or \( > \) | dotted line | No |
The origin \( (0, 0) \) is the easiest test point because every term becomes zero. It cannot be used when the boundary line passes through the origin, as in \( y \ge 2x \). Then choose a point clearly off the line, such as \( (1, 0) \) or \( (0, 1) \).
Graphs of the Three Statements
For \( x \le 2 \), the boundary \( x = 2 \) is a vertical line meeting the x-axis at 2. The sign is \( \le \), so the line is solid. Testing the origin gives \( 0 \le 2 \), which is true, so the side containing the origin, the left side, is shaded.
For \( x \ge 16 \), the boundary \( x = 16 \) is a solid vertical line meeting the x-axis at 16. Testing the origin gives \( 0 \ge 16 \), which is false, so the side away from the origin, the right side, is shaded.
Rupesh's inequality has two variables, so its boundary \( 15x + 25y = 750 \) is a slanting line. Putting \( x = 0 \) gives \( 25y = 750 \), so \( y = 30 \). Putting \( y = 0 \) gives \( 15x = 750 \), so \( x = 50 \). The solid line therefore joins \( (0, 30) \) and \( (50, 0) \). Testing the origin gives \( 0 \le 750 \), which is true, so Rupesh's solution region is the side of the line that contains the origin.
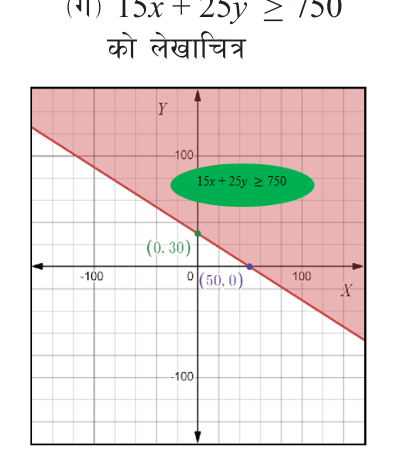
Comparing the two sides of this line is a good habit. Swapping \( \le \) for \( \ge \) keeps the same boundary line but moves the shading to the opposite side.
Inequalities in One Variable
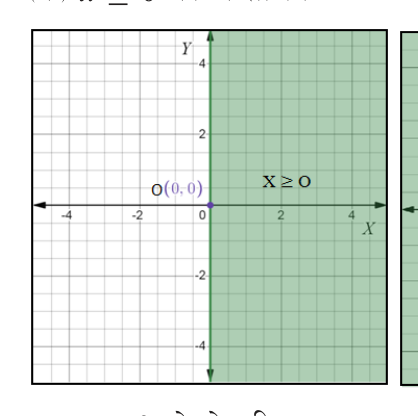
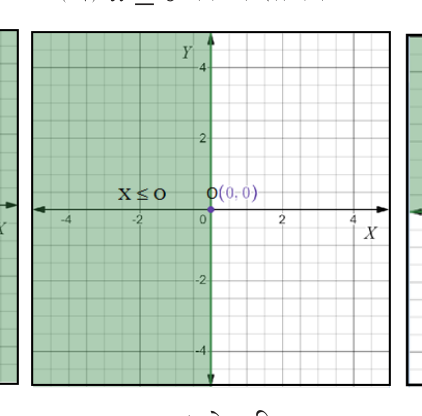
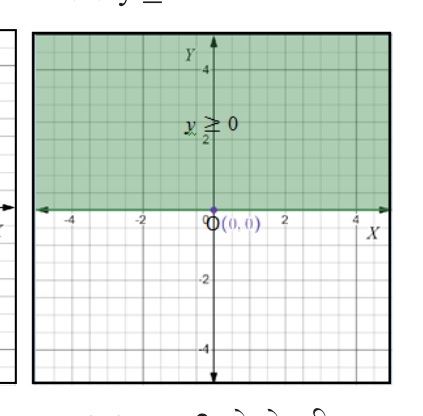
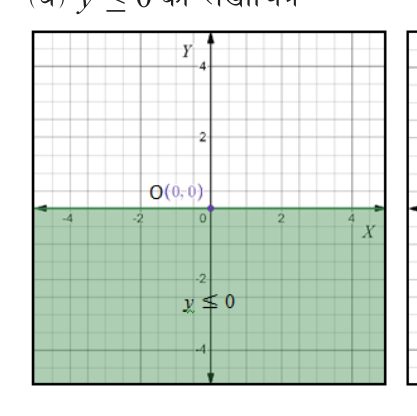
When an inequality has only \( x \), its boundary \( x = a \) is a vertical line parallel to the y-axis, meeting the x-axis at \( (a, 0) \). When it has only \( y \), its boundary \( y = b \) is a horizontal line parallel to the x-axis, meeting the y-axis at \( (0, b) \). Here are four inequalities with solid boundaries.
- (a) \( x \ge 0 \): the boundary \( x = 0 \) is the y-axis itself. Every point to its right has a positive x-coordinate, so the region on and to the right of the y-axis is shaded.
- (b) \( x \le 0 \): the boundary is again the y-axis, and the region on and to the left of it is shaded.
- (c) \( y \ge 0 \): the boundary \( y = 0 \) is the x-axis, and the region on and above it is shaded.
- (d) \( y \le 0 \): the boundary is the x-axis, and the region on and below it is shaded.
Now two inequalities with strict signs, whose boundaries are dotted.
- (e) \( x > -1 \): the boundary \( x = -1 \) is a vertical line through \( (-1, 0) \), drawn dotted because the sign is \( > \). Testing the origin gives \( 0 > -1 \), which is true, so the right side, holding the origin, is shaded.
- (f) \( x < 2 \): the boundary \( x = 2 \) is a dotted vertical line through \( (2, 0) \). Testing the origin gives \( 0 < 2 \), which is true, so the left side is shaded.
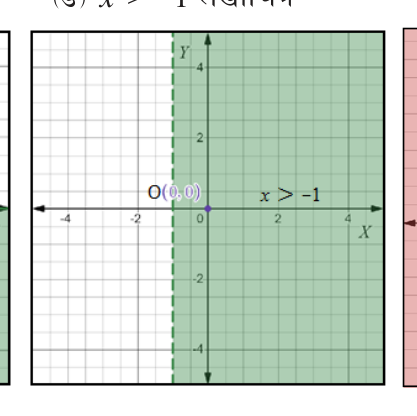
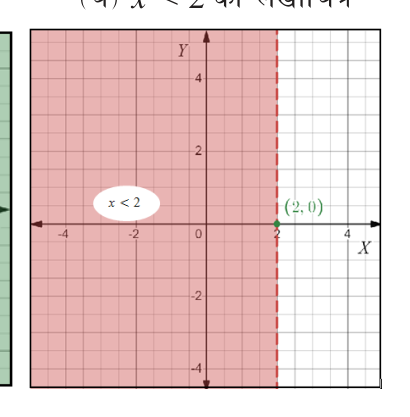
For one variable the side can be read straight from the sign: \( x > a \) or \( x \ge a \) is to the right of the line, \( x < a \) or \( x \le a \) to the left, \( y > b \) or \( y \ge b \) above, and \( y < b \) or \( y \le b \) below.
Graphing an Inequality in Two Variables
For an inequality in two variables the boundary is a slanting line. Two points fix a line, and the easiest two are where it cuts the axes. Worked example: show \( 2x + 3y \le 6 \) on a graph.
Step 1: Replacing \( \le \) with \( = \) gives the equation of the boundary line, called equation (i):
\[ 2x + 3y = 6 \]
Step 2: Finding the point where the line cuts the y-axis by putting \( x = 0 \):
\[ 3y = 6, \text{ so } y = 2 \]
Finding the point where the line cuts the x-axis by putting \( y = 0 \):
\[ 2x = 6, \text{ so } x = 3 \]
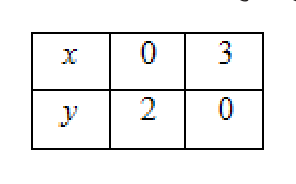
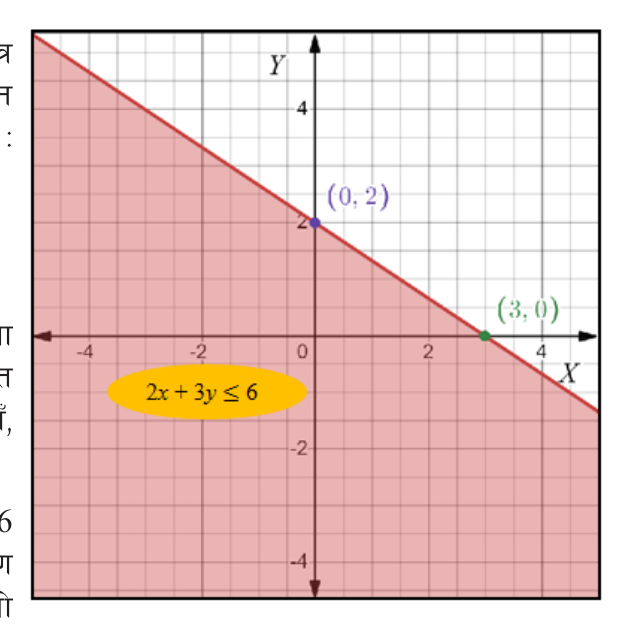
Step 3: Drawing the line. The sign is \( \le \), so the line through \( (0, 2) \) and \( (3, 0) \) is drawn solid.
Step 4: Putting the test point \( O(0, 0) \) into the inequality:
\[ 2 \times 0 + 3 \times 0 \le 6 \]
Simplifying the left side:
\[ 0 \le 6 \]
This is true.
Step 5: Shading. The test point made the inequality true, so the solution region is the side of the line containing the origin, and that side is shaded.
System of Linear Inequalities
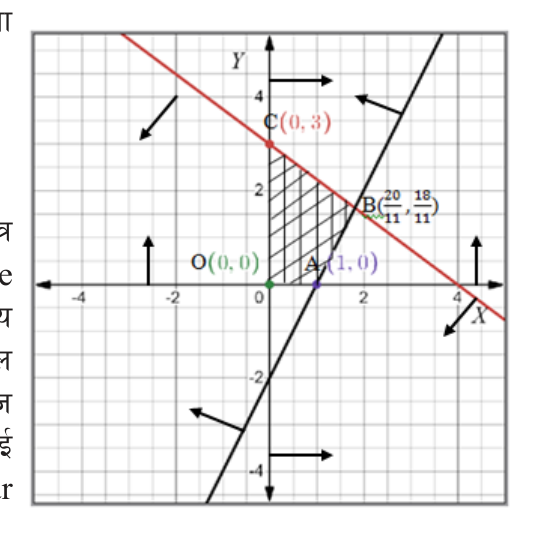
Often several conditions must hold at the same time. Rupesh cannot spend more than Rs. 750, and he also cannot buy a negative number of pens or copies. To show such conditions together, draw every inequality on the same graph. The part of the plane that lies on the correct side of every line is the region that satisfies all of them. Worked example: show \( 3x + 4y \le 12 \), \( 2x - y \le 2 \), \( x \ge 0 \) and \( y \ge 0 \) on one graph and find their common region.
Step 1: The boundary of the first inequality is \( 3x + 4y = 12 \). Putting \( x = 0 \) and then \( y = 0 \):
\[ x = 0 \Rightarrow y = 3 \]
\[ y = 0 \Rightarrow x = 4 \]
So the solid line joins \( (0, 3) \) and \( (4, 0) \). Testing the origin:
\[ 3 \times 0 + 4 \times 0 = 0 \le 12 \]
This is true, so the region lies on the origin side of this line.
Step 2: The boundary of the second inequality is \( 2x - y = 2 \). Putting \( x = 0 \) and then \( y = 0 \):
\[ x = 0 \Rightarrow y = -2 \]
\[ y = 0 \Rightarrow x = 1 \]
So the solid line joins \( (0, -2) \) and \( (1, 0) \). Testing the origin:
\[ 2 \times 0 - 0 = 0 \le 2 \]
This is true, so the region lies on the origin side of this line too.
Step 3: \( x \ge 0 \) keeps the region on or to the right of the y-axis, and \( y \ge 0 \) keeps it on or above the x-axis. Together they hold it in the first quadrant.
Step 4: One corner, B, is where the two slanting lines cross. Rearranging \( 2x - y = 2 \) to make \( y \) the subject:
\[ y = 2x - 2 \]
Substituting this into \( 3x + 4y = 12 \):
\[ 3x + 4(2x - 2) = 12 \]
Opening the bracket and collecting the x terms:
\[ 11x - 8 = 12 \]
Adding 8 to both sides and dividing by 11:
\[ x = \frac{20}{11} \]
Putting this value back into \( y = 2x - 2 \):
\[ y = \frac{40}{11} - \frac{22}{11} = \frac{18}{11} \]
Step 5: Shading the part that lies on the correct side of all four lines. It is the quadrilateral OABC with corners \( O(0, 0) \), \( A(1, 0) \), \( B\left(\frac{20}{11}, \frac{18}{11}\right) \) and \( C(0, 3) \).
The Feasible Region and Its Corners
Feasible region: the common solution region of two or more linear inequalities, that is, the part of the graph that satisfies every one of them.
Convex polygonal region: a region with straight sides and no dent, so that the segment joining any two of its points lies entirely inside it.
System of linear inequalities: two or more linear inequalities shown on the same graph whose common solution region is a convex polygon. The vertices of this common region satisfy all the given inequalities.
In the worked example, OABC is the feasible region and it is a convex quadrilateral. Checking corner B shows why its vertices satisfy every inequality. For the first inequality:
\[ 3 \times \frac{20}{11} + 4 \times \frac{18}{11} = \frac{132}{11} = 12 \le 12 \]
For the second inequality:
\[ 2 \times \frac{20}{11} - \frac{18}{11} = \frac{22}{11} = 2 \le 2 \]
Both coordinates of B are also positive, so \( x \ge 0 \) and \( y \ge 0 \) hold. B lies on two boundary lines at once, which is exactly why it is a corner: it is as far as the region can stretch in that direction while still obeying every condition.
The feasible region is where the answer to a linear programming problem lives. The greatest and the smallest values of a quantity such as profit or cost are found from this common region, by looking at its vertices.
Finding the Inequalities from a Shaded Graph
The process can also run backwards. Given a shaded region, find the inequalities it shows. For each boundary line, first find its equation from two points on it, then use a test point inside the shaded region to decide the sign.
A line that cuts the x-axis at \( (a, 0) \) and the y-axis at \( (0, b) \) has the equation:
\[ \frac{x}{a} + \frac{y}{b} = 1 \]
Step 1: Line AB cuts the x-axis at \( -1 \) and the y-axis at 2. Putting \( a = -1 \) and \( b = 2 \):
\[ \frac{x}{-1} + \frac{y}{2} = 1 \]
Step 2: Multiplying both sides by 2 to clear the fractions:
\[ -2x + y = 2 \]
Multiplying both sides by \( -1 \) gives the equation of AB:
\[ 2x - y = -2 \]
Step 3: The origin lies in the shaded region, so it is used as the test point. Putting \( O(0, 0) \) into the left side:
\[ 2 \times 0 - 0 = 0 \]
Since \( 0 \) is greater than \( -2 \) and the line is solid, the shaded side of AB is:
\[ 2x - y \ge -2 \]
Step 4: Line CD cuts the x-axis at 4 and the y-axis at 3. Putting \( a = 4 \) and \( b = 3 \):
\[ \frac{x}{4} + \frac{y}{3} = 1 \]
Multiplying both sides by 12 gives the equation of CD:
\[ 3x + 4y = 12 \]
Step 5: Putting the test point \( O(0, 0) \) into the left side:
\[ 3 \times 0 + 4 \times 0 = 0 < 12 \]
The line is solid, so the shaded side of CD is:
\[ 3x + 4y \le 12 \]
So the shaded region is described by the pair \( 2x - y \ge -2 \) and \( 3x + 4y \le 12 \).
When reading a graph, the test point must lie inside the shaded region. A point from the unshaded side gives the opposite sign. Also look at each line: a solid line means \( \le \) or \( \ge \), and a dotted line means \( < \) or \( > \).
The full lesson is waiting for you
The notes are free to read in full. A free account opens the rest of the practice, and tracks your progress and confidence score for every subject. Presentations and videos need approval from Learn Yeti.