Reading a Venn Diagram of a Survey
A survey asks a group of people the same question and records their answers. A Venn diagram shows those answers at a glance. Suppose the fifteen students of grade 10 with roll numbers 1 to 15 are asked whether they like Mathematics or Science. The rectangle stands for the universal set U, which is the whole group that was asked. The left circle holds the students who like Mathematics and the right circle holds those who like Science. Each roll number is written in exactly one place, the place that matches that student's answer.
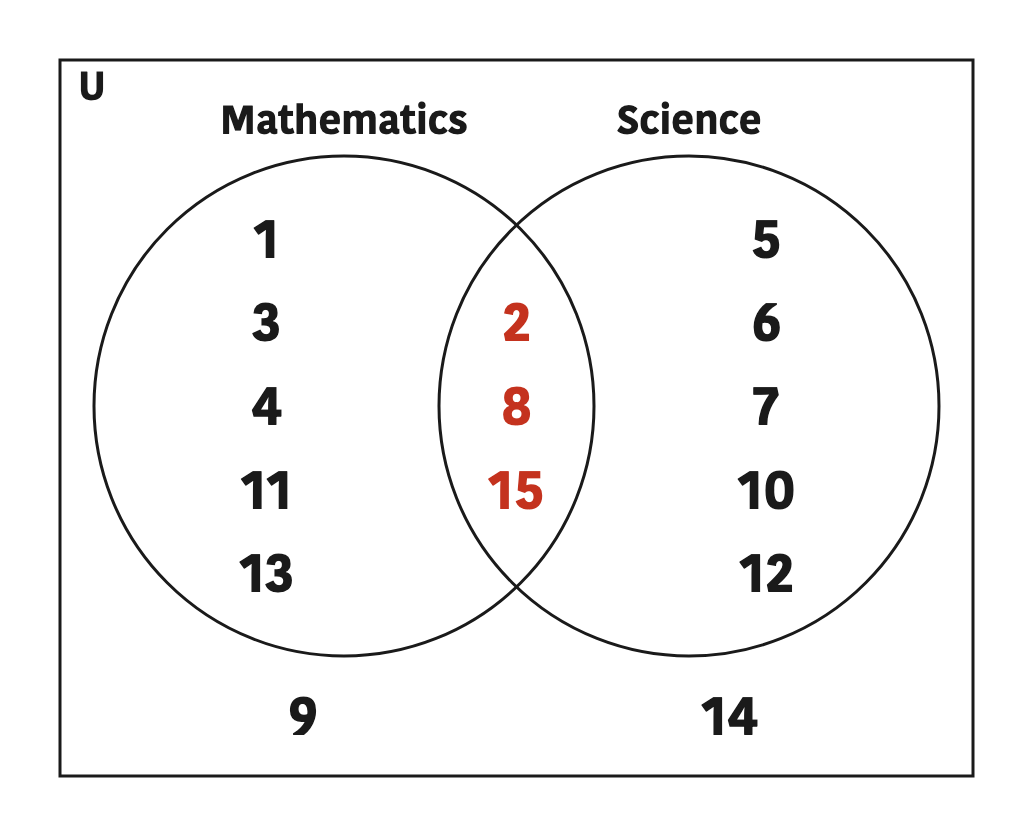
Let M be the set of students who like Mathematics and S the set who like Science. Reading the diagram one part at a time gives these sets, each with its cardinal number:
- Like Mathematics: \( M = \{1, 2, 3, 4, 8, 11, 13, 15\} \), so \( n(M) = 8 \).
- Like Mathematics only: \( \{1, 3, 4, 11, 13\} \), cardinal number 5.
- Like Science: \( S = \{2, 5, 6, 7, 8, 10, 12, 15\} \), so \( n(S) = 8 \).
- Like Science only: \( \{5, 6, 7, 10, 12\} \), cardinal number 5.
- Like both subjects: \( M \cap S = \{2, 8, 15\} \), so \( n(M \cap S) = 3 \).
- Like neither subject: \( \{9, 14\} \), cardinal number 2.
- Students surveyed: all of them, \( n(U) = 15 \).
Cardinal number: The number of distinct elements in a set A is called its cardinal number and is written \( n(A) \). Counting how many elements a set has is called finding its cardinality.
Now look at these counts together. \( n(M) + n(S) = 8 + 8 = 16 \), yet only \( 5 + 3 + 5 = 13 \) students like at least one of the subjects. The difference is 3, which is exactly the number in the overlap. Students 2, 8 and 15 were counted once among the Mathematics lovers and again among the Science lovers. Every formula in this topic is a way of handling that double count correctly.
The Four Regions of Two Overlapping Sets
Overlapping sets: Two sets that have some elements in common are called overlapping sets. In a Venn diagram their circles cross each other.
When two overlapping sets A and B are drawn inside a universal set U, the two circles cut the rectangle into four separate regions. Every member of U falls in exactly one of these regions, so counting region by region never counts anyone twice.
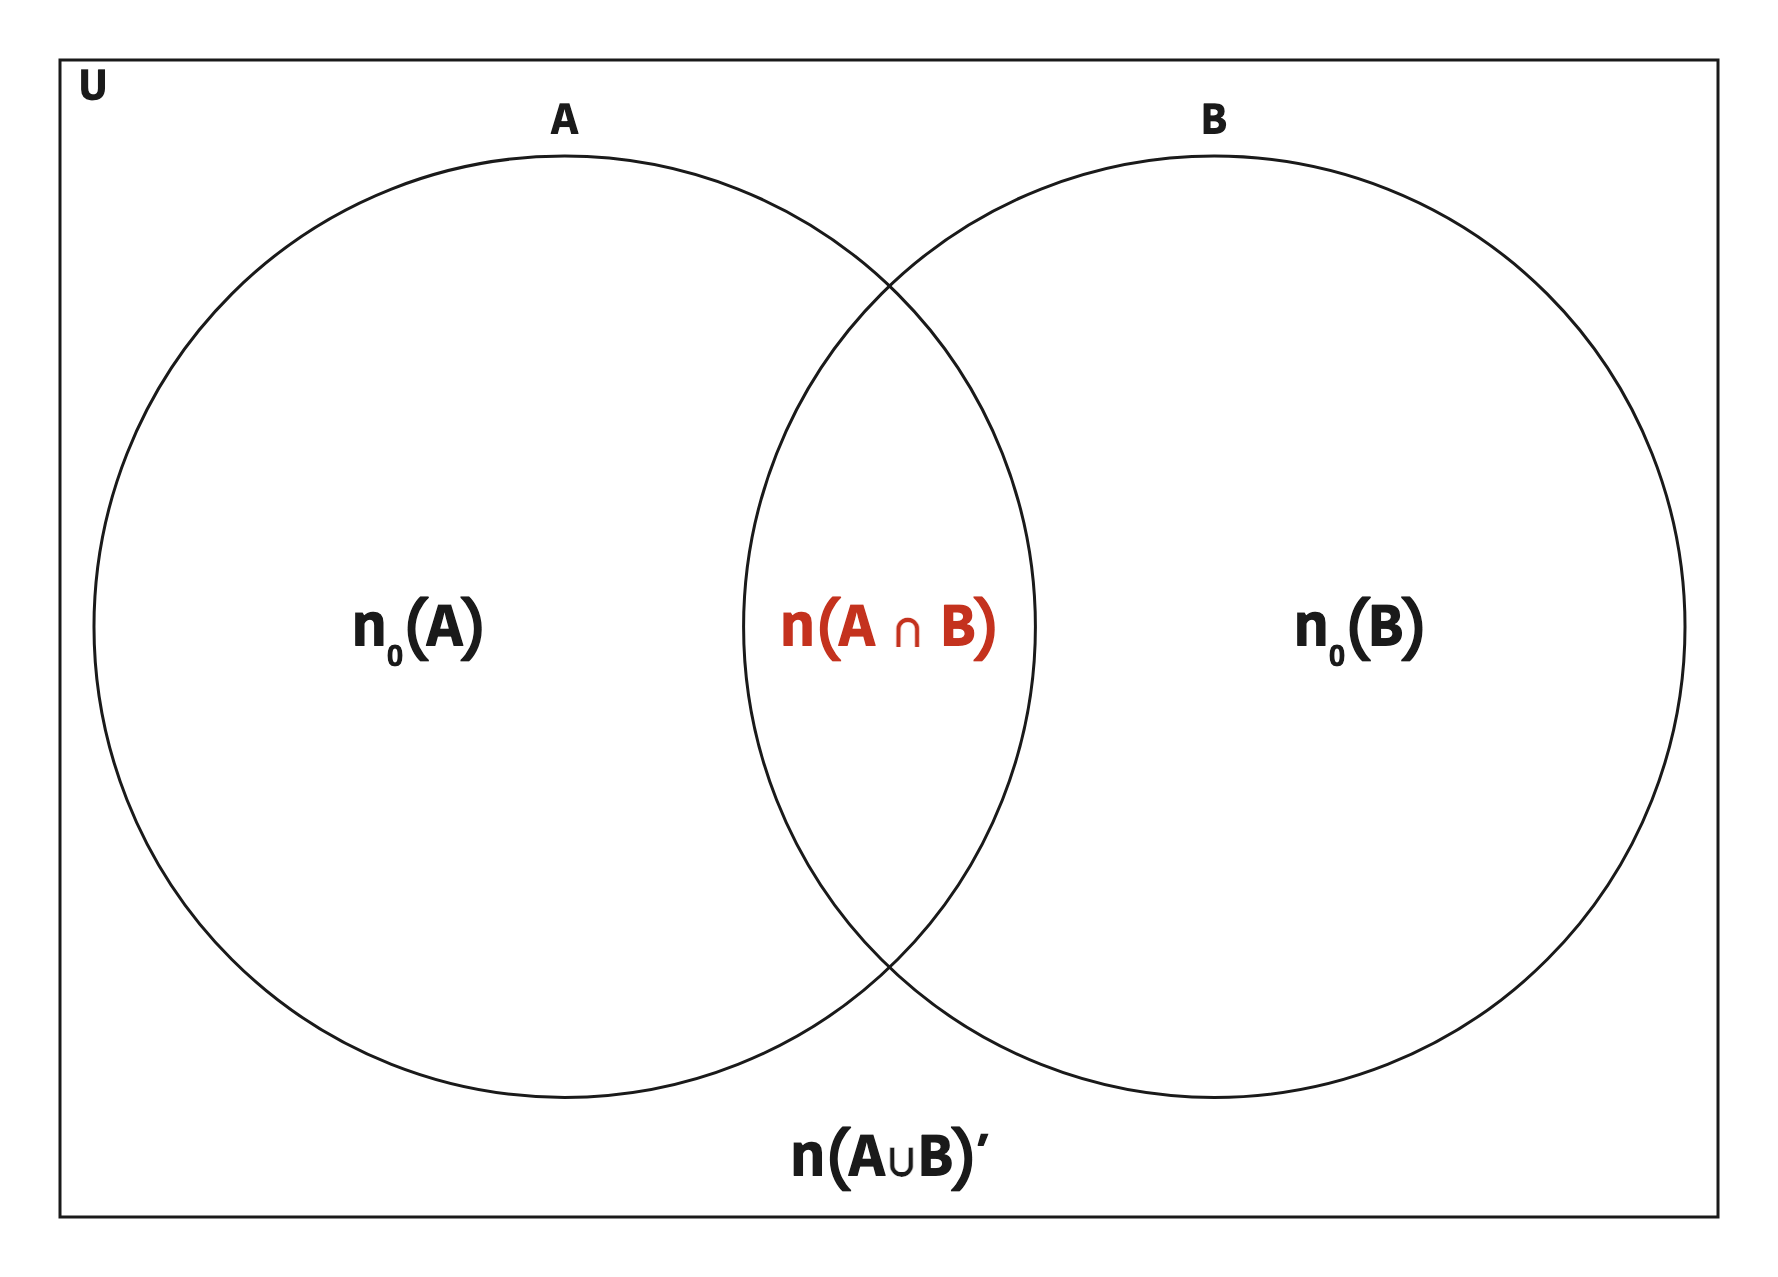
| Region | Who is in it | Written as |
| Circle A outside the overlap | In A but not in B (A only) | \( n_0(A) \) |
| The overlap | In both A and B | \( n(A \cap B) \) |
| Circle B outside the overlap | In B but not in A (B only) | \( n_0(B) \) |
| Outside both circles | In neither A nor B | \( n(\overline{A \cup B}) \) |
Union: \( A \cup B \) is the set of elements that belong to A, or to B, or to both. \( n(A \cup B) \) counts everyone inside at least one circle.
Intersection: \( A \cap B \) is the set of elements common to both A and B. In a Venn diagram it is the part where the two circles overlap.
A only: \( n_0(A) \) is the number of elements that belong to A but not to B. In the same way, \( n_0(B) \) is the number that belong to B only.
Neither: \( n(\overline{A \cup B}) \) is the number of elements of U that belong to neither A nor B. The bar on top means complement: everything in U that lies outside \( A \cup B \).
A whole circle is made of its only part together with the overlap. Written as formulas:
\[ n(A) = n_0(A) + n(A \cap B) \]
\[ n(B) = n_0(B) + n(A \cap B) \]
So to find an only part, take the overlap away from the whole circle. This one move appears in nearly every problem that follows.
Filling a Venn Diagram: Coffee and Tea
Grade 10 students were asked whether they like coffee or tea. The survey found that 15 like coffee, 10 like tea, 6 like both and 5 like neither. Let C be the set of students who like coffee and T the set who like tea. So \( n(C) = 15 \), \( n(T) = 10 \), \( n(C \cap T) = 6 \) and \( n(\overline{C \cup T}) = 5 \). The task is to put these facts into a Venn diagram and find how many like coffee only, how many like tea only, and how many students are in the class.
The 15 coffee lovers fill the whole coffee circle, overlap included. Writing 15 in the coffee only part would count the 6 students who like both a second time. Always fill the overlap first.
Step 1: The overlap is given directly, so it is written in first:
\[ n(C \cap T) = 6 \]
Step 2: Coffee only is the whole coffee circle less the overlap, \( n_0(C) = n(C) - n(C \cap T) \). Putting in the numbers:
\[ n_0(C) = 15 - 6 = 9 \]
Step 3: Tea only is found the same way, taking the overlap from the whole tea circle:
\[ n_0(T) = 10 - 6 = 4 \]
Step 4: The students who like neither go outside both circles but inside the rectangle:
\[ n(\overline{C \cup T}) = 5 \]
Step 5: Adding the four regions counts every student exactly once:
\[ n(U) = 9 + 6 + 4 + 5 = 24 \]
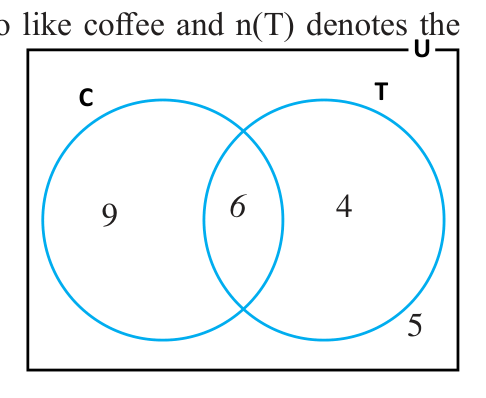
So 9 students like coffee only, 4 like tea only, and the class has 24 students. The three regions inside the circles add to \( 9 + 6 + 4 = 19 \). These 19 are the students who like at least one of the two drinks.
Formulas for the Cardinality of Two Sets
In the coffee and tea survey, 15 like coffee and 10 like tea, but \( 15 + 10 = 25 \) is more than the 19 who like at least one drink. The 6 students in the overlap were counted in both numbers. Taking them away once leaves every student counted exactly once. That gives the main formula for two overlapping sets:
\[ n(A \cup B) = n(A) + n(B) - n(A \cap B) \]
Checking with the survey, \( 15 + 10 - 6 = 19 \), the same as counting the regions one by one. The union can also be found by adding its three regions directly:
\[ \begin{aligned} n(A \cup B) &= n_0(A) + n_0(B) \\ &\quad + n(A \cap B) \end{aligned} \]
The four regions also give the other rules for two sets:
- A only: \( n_0(A) = n(A) - n(A \cap B) \)
- B only: \( n_0(B) = n(B) - n(A \cap B) \)
- If A and B are disjoint sets: \( n(A \cup B) = n(A) + n(B) \)
- If U has no elements other than those of A and B: \( n(U) = n(A \cup B) \)
- If U also has elements outside A and B: \( n(U) = n(A \cup B) + n(\overline{A \cup B}) \)
Disjoint sets: Two sets with no element in common are called disjoint sets. For them \( n(A \cap B) = 0 \), so \( n(A \cup B) = n(A) + n(B) \).
There is one more special case. If A is a subset of B, every element of A is already inside B, so circle A sits wholly inside circle B. Then the overlap is all of A and the union is all of B: \( n(A \cap B) = n(A) \) and \( n(A \cup B) = n(B) \).
At Least One, At Most One and Exactly One
Survey questions use three phrases again and again. Each one names a particular group of regions, so each has its own formula.
At least one: Belonging to A, or to B, or to both. This is the union, so its count is \( n(A \cup B) = n(A) + n(B) - n(A \cap B) \), which can also be written \( n_0(A) + n_0(B) + n(A \cap B) \).
At most one: Belonging to one set only or to none, but never to both. It is everyone except the overlap: \( n(\overline{A \cap B}) = n(U) - n(A \cap B) \).
Exactly one (only one): Belonging to one of the sets and not the other. It is the two only parts added together.
\[ \begin{aligned} & n_0(A) + n_0(B) \\ &= n(A) + n(B) - 2\,n(A \cap B) \end{aligned} \]
Why is the overlap taken away twice here? Adding \( n(A) \) and \( n(B) \) counts the overlap two times, and exactly one must leave the overlap out completely, so both of those counts are removed. In the coffee and tea survey, the phrases give these values:
| Phrase | Regions included | Coffee and tea |
| At least one | A only, both, B only | \( 9 + 6 + 4 = 19 \) |
| At most one | A only, B only, neither | \( 24 - 6 = 18 \) |
| Exactly one | A only, B only | \( 9 + 4 = 13 \) |
| Neither | Outside both circles | 5 |
The formula for exactly one gives the same answer: \( 15 + 10 - 2 \times 6 = 13 \).
At most one includes the people who like neither, because none is not more than one. At least one leaves them out. Mixing these two up is the most common slip in survey problems.
Example 1: Finding How Many Like Both
In a survey of 300 people of a community, 175 liked cricket, 150 liked football and 25 liked neither game. Show this in a Venn diagram, and find how many like both games and how many like exactly one game.
Let C and F be the sets of people who like cricket and football, and U the set of everyone surveyed. Then \( n(U) = 300 \), \( n(C) = 175 \), \( n(F) = 150 \) and \( n(\overline{C \cup F}) = 25 \). The overlap is not given, so let \( n(C \cap F) = x \). Cricket only is then \( 175 - x \) and football only is \( 150 - x \).
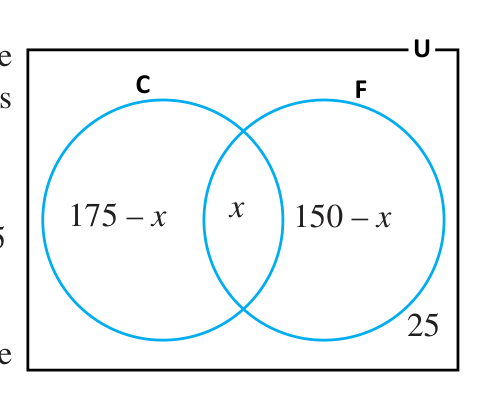
Step 1: The four regions together make up all 300 people:
\[ (175 - x) + x + (150 - x) + 25 = 300 \]
Step 2: Removing the brackets and collecting like terms, since \( 175 + 150 + 25 = 350 \) and \( -x + x - x = -x \):
\[ 350 - x = 300 \]
Step 3: Moving x to one side and the numbers to the other:
\[ x = 350 - 300 = 50 \]
So \( n(C \cap F) = 50 \), which means 50 people like both games.
Step 4: Cricket only, the cricket circle less the overlap:
\[ n_0(C) = 175 - 50 = 125 \]
Step 5: Football only, the football circle less the overlap:
\[ n_0(F) = 150 - 50 = 100 \]
Step 6: Exactly one game means cricket only or football only, so the two only parts are added:
\[ n_0(C) + n_0(F) = 125 + 100 = 225 \]
Check: \( 125 + 50 + 100 + 25 = 300 \). So 50 people like both games and 225 like exactly one.
Example 2: When the Only Parts Are Given
A survey of 120 grade 10 students found that 30 like only Mathematics, 40 like only English and 10 like neither subject. Find how many like both subjects and how many like at least one subject.
Let M and E be the sets of students who like Mathematics and English. This time the only parts are given: \( n_0(M) = 30 \) and \( n_0(E) = 40 \). Also \( n(U) = 120 \) and \( n(\overline{M \cup E}) = 10 \). Let \( n(M \cap E) = x \).
When a number is given as an only count, it goes straight into its region. Nothing is subtracted from it.
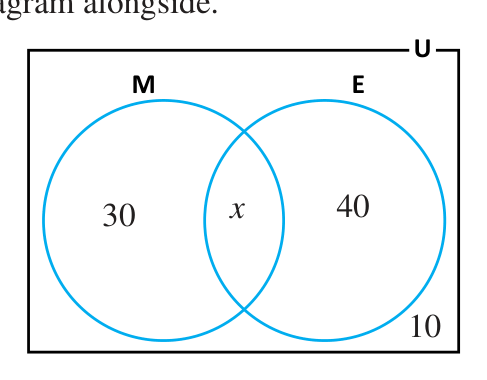
Step 1: Adding the four regions gives the total:
\[ 30 + x + 40 + 10 = 120 \]
Step 2: Adding the known numbers, \( 30 + 40 + 10 = 80 \):
\[ 80 + x = 120 \]
Step 3: Subtracting 80 from both sides:
\[ x = 120 - 80 = 40 \]
So 40 students like both subjects.
Step 4: At least one subject is the union, the three regions inside the circles:
\[ n(M \cup E) = 30 + 40 + 40 = 110 \]
Taking the 10 who like neither away from the whole class gives the same answer: \( 120 - 10 = 110 \).
Example 3: A Survey in Percentages
In a survey of the students of a school who appeared in the SEE, 75% were interested in studying science and 55% in studying staff nurse, 5% gave no information, and 21 students were interested in both. Find the total number of students surveyed and the number interested in staff nurse only.
Let S and N be the sets of students interested in science and in staff nurse. The total is unknown, so let \( n(U) = x \). Each percentage now becomes a part of x: 75% of x is \( 0.75x \). So \( n(S) = 0.75x \), \( n(N) = 0.55x \) and \( n(S \cap N) = 21 \). The 5% who gave no information sit outside both circles: \( n(\overline{S \cup N}) = 0.05x \).
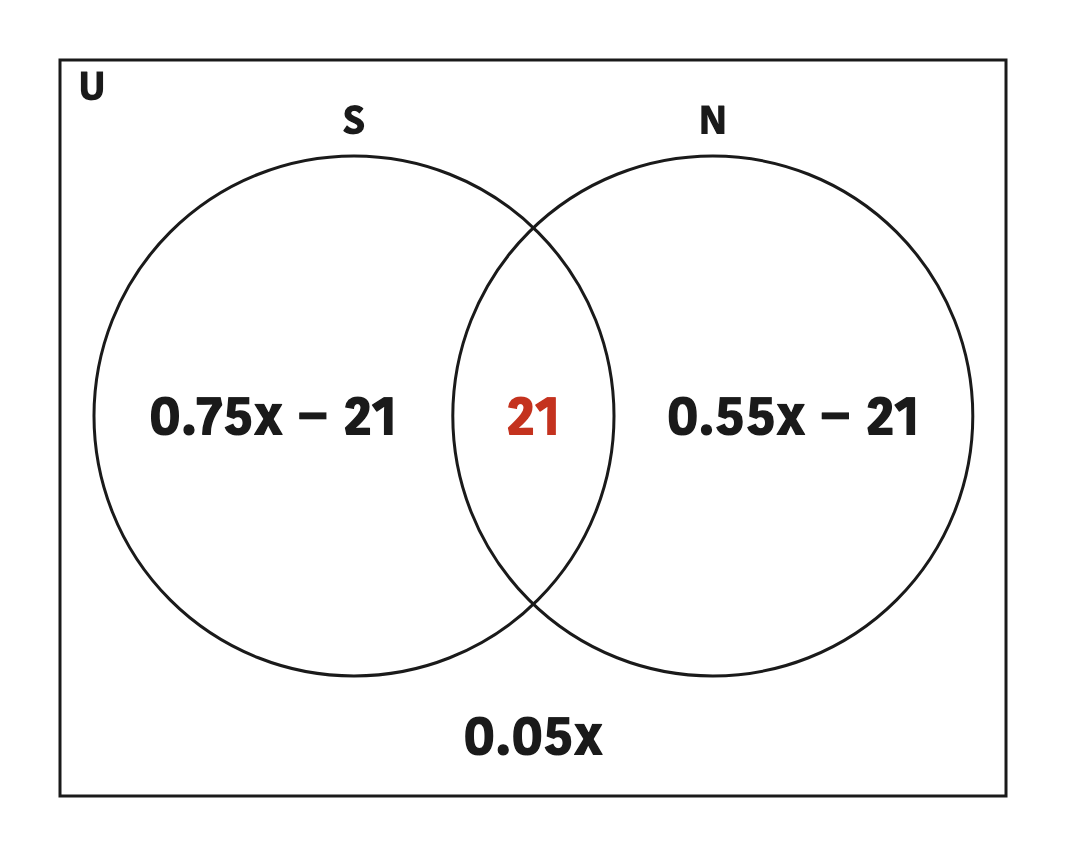
Step 1: The four regions add up to the whole group x:
\[ \begin{aligned} &(0.75x - 21) + 21 \\ &+ (0.55x - 21) + 0.05x = x \end{aligned} \]
Step 2: Collecting the x terms, \( 0.75x + 0.55x + 0.05x = 1.35x \), and the numbers, \( -21 + 21 - 21 = -21 \):
\[ 1.35x - 21 = x \]
Step 3: Taking x to the left side and 21 to the right:
\[ 1.35x - x = 21 \]
Step 4: Simplifying the left side:
\[ 0.35x = 21 \]
Step 5: Dividing both sides by 0.35:
\[ x = \frac{21}{0.35} = 60 \]
So 60 students were surveyed.
Step 6: Staff nurse only is \( 0.55x - 21 \). Putting in \( x = 60 \):
\[ 0.55 \times 60 - 21 = 33 - 21 = 12 \]
So 12 students were interested in staff nurse only. Check: science only is \( 45 - 21 = 24 \), the outside part is \( 0.05 \times 60 = 3 \), and \( 24 + 21 + 12 + 3 = 60 \).
When percentages are given but the total is not, let the total be x and write each percentage as a decimal times x.
Example 4: A Ratio of the Two Whole Sets
In a survey of 300 foreign tourists visiting Nepal, the numbers who visited Pokhara and Lumbini were in the ratio 2 : 3. Of them, 90 visited both places and 60 visited neither. Find how many visited only one place and how many visited at least one place.
Let P and L be the sets of tourists who visited Pokhara and Lumbini. Here \( n(U) = 300 \), \( n(P \cap L) = 90 \) and \( n(\overline{P \cup L}) = 60 \). The ratio 2 : 3 is of the whole sets, so let \( n(P) = 2x \) and \( n(L) = 3x \). Then Pokhara only is \( 2x - 90 \) and Lumbini only is \( 3x - 90 \).
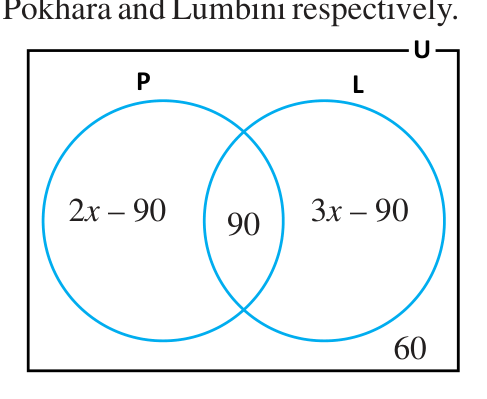
Step 1: The four regions add up to the 300 tourists:
\[ \begin{aligned} &(2x - 90) + 90 \\ &+ (3x - 90) + 60 = 300 \end{aligned} \]
Step 2: Collecting like terms, \( 2x + 3x = 5x \) and \( -90 + 90 - 90 + 60 = -30 \):
\[ 5x - 30 = 300 \]
Step 3: Adding 30 to both sides:
\[ 5x = 330 \]
Step 4: Dividing both sides by 5:
\[ x = \frac{330}{5} = 66 \]
Step 5: Pokhara only, putting in \( x = 66 \):
\[ n_0(P) = 2 \times 66 - 90 = 42 \]
Step 6: Lumbini only, in the same way:
\[ n_0(L) = 3 \times 66 - 90 = 108 \]
Step 7: Only one place, adding the two only parts:
\[ 42 + 108 = 150 \]
Step 8: At least one place, which is everyone except the 60 who visited neither:
\[ n(P \cup L) = 300 - 60 = 240 \]
Check: \( 42 + 90 + 108 + 60 = 300 \). Also \( n(P) = 132 \) and \( n(L) = 198 \), and \( 132 : 198 = 2 : 3 \).
Example 5: A Ratio of the Only Parts
In a survey of 200 grade 10 students, the numbers who like only Mathematics and only English are in the ratio 2 : 3. 30% like both subjects and 15% like neither. Find the difference between the number who like Mathematics and the number who like English.
Let M and E be the sets of students who like Mathematics and English. Here the total \( n(U) = 200 \) is known, so the percentages can be turned into numbers at once: \( n(M \cap E) = 30\% \text{ of } 200 = 60 \) and \( n(\overline{M \cup E}) = 15\% \text{ of } 200 = 30 \). The ratio is of the only parts, so let \( n_0(M) = 2x \) and \( n_0(E) = 3x \).
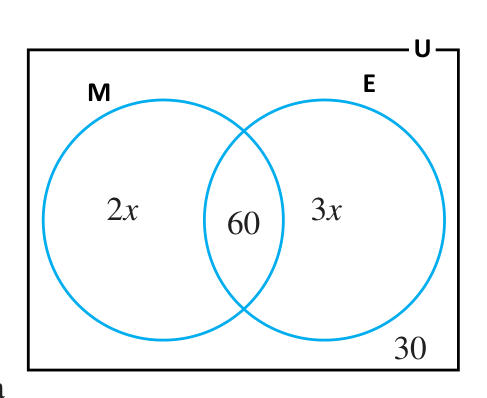
Step 1: The four regions add up to 200:
\[ 2x + 60 + 3x + 30 = 200 \]
Step 2: Collecting like terms:
\[ 5x + 90 = 200 \]
Step 3: Subtracting 90 from both sides:
\[ 5x = 110 \]
Step 4: Dividing both sides by 5:
\[ x = \frac{110}{5} = 22 \]
Step 5: The whole Mathematics circle, its only part plus the overlap:
\[ n(M) = 2 \times 22 + 60 = 104 \]
Step 6: The whole English circle, in the same way:
\[ n(E) = 3 \times 22 + 60 = 126 \]
Step 7: The difference, taking the smaller count from the larger:
\[ 126 - 104 = 22 \]
So 22 more students like English than like Mathematics. Check: \( 44 + 60 + 66 + 30 = 200 \).
Read carefully which numbers the ratio compares. In the tourist survey the ratio was of the whole sets, so the circles were 2x and 3x and the overlap had to be subtracted. Here the ratio is of the only parts, so 2x and 3x go straight into the only regions.
Reading Every Count from One Diagram
A Venn diagram of sets M and E has 20 people in M only, 60 in both, 30 in E only and 15 outside both circles. Every count about these two sets can be read from these four numbers.
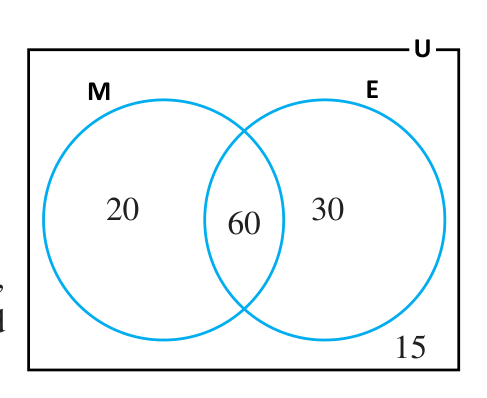
- The only parts are read straight off: \( n_0(M) = 20 \) and \( n_0(E) = 30 \).
- The whole M circle: \( n(M) = 20 + 60 = 80 \).
- The whole E circle: \( n(E) = 30 + 60 = 90 \).
- The overlap: \( n(M \cap E) = 60 \).
- The union: \( n(M \cup E) = 20 + 60 + 30 = 110 \), which agrees with \( 80 + 90 - 60 = 110 \).
- In neither set: \( n(\overline{M \cup E}) = 15 \).
- Everyone: \( n(U) = 110 + 15 = 125 \).
A Method for Any Survey Problem
Every example above was solved in the same order. Use this order for any survey problem about two sets:
- Name each set with a letter and say what it stands for.
- Write every given fact in symbols, turning percentages and ratios into numbers or expressions in x.
- Call the unknown quantity x.
- Draw the diagram and fill the overlap first, then the only parts, then the outside.
- Add the four regions, set the sum equal to the total, and solve for x.
- Answer the question actually asked, deciding whether it wants at least one, at most one or exactly one.
- Check that the four regions add up to the total.
The full lesson is waiting for you
The notes are free to read in full. A free account opens the rest of the practice, and tracks your progress and confidence score for every subject. Presentations and videos need approval from Learn Yeti.