People and Animals on the Move
Two ideas run through this whole unit. The first is population: how many people, or how many animals, live in a place at a given time. The second is migration: movement from one place to another, either to settle for good or to stay for a season. The four scenes below each show one side of these ideas. Look at each one and ask yourself what it tells you about numbers or about movement.
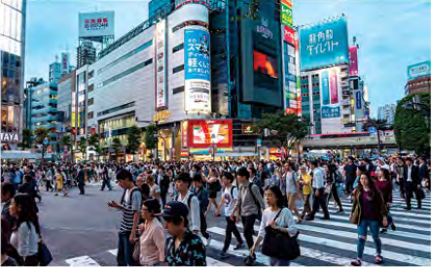
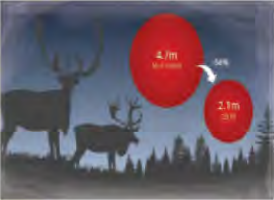
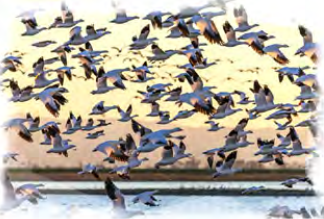
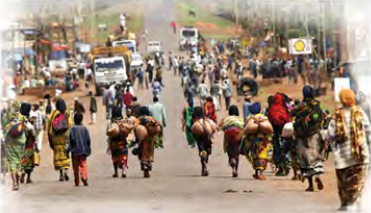
The city crossing shows population as crowding. Big cities pull people in from the countryside and from other countries, so they grow faster than the land around them. The reindeer picture shows the opposite: a population of wild animals losing more than half its members, a warning that numbers can fall as well as rise. The flock of geese shows migration as a natural, regular journey that birds make every year. The people on the road show migration of a harder kind, when families leave home because staying has become dangerous or impossible. The rest of the unit follows both ideas: first the numbers, then the movement.
Population: the total number of people, or of one kind of animal, living in a particular place at a particular time.
Migration: the movement of people or animals from one place to another, to live there permanently or to stay for a season.
What Changes the Size of a Population
Nepal counts its people in a national census every ten years. The census of 2078 B.S. (2021 A.D.) found 29,164,578 people living in the country, a little over 29 million. That number is never fixed. Three things push it up or down.
- Births add people. The level of births in a population is called its fertility, and demographers usually measure it as the average number of children born per woman.
- Deaths remove people. The level of deaths is called mortality. Better food, clean water and medicine lower mortality, so more people live longer.
- Migration moves people in and out. A country loses people when its citizens leave to live abroad and gains people when others arrive to settle.
For the world as a whole, nobody arrives from outside, so only the first two count. That is why the report on world population that follows keeps returning to exactly two words: fertility and mortality.
Fertility: the rate at which babies are born in a population, often given as the average number of births per woman.
Mortality: the number of deaths in a particular situation or period of time.
A Century of World Population Growth
The first reading is a report adapted from the United Nations' World Population Prospects 2022. It is written in the style of an official report: dense with figures, careful with words like 'estimated', 'projected' and 'could', and interested in trends rather than stories. Reading it well means keeping hold of which figure belongs to which year and which region.
The headline is growth. The world today holds more than three times as many people as it did in the middle of the twentieth century. From 1950 it took about 37 years for human numbers to double, and the total passed 5 billion in 1987. That means the population in 1950 was roughly 2.5 billion. At the rate estimated in the report, it could double again in about 70 years and pass 10 billion by 2059.
- 1950: about 2.5 billion people.
- 1962 to 1965: the fastest growth of the whole century, an average of 2.1 percent a year.
- 1987: the world passes 5 billion.
- 2020: for the first time since 1950, growth falls below one percent a year.
- 2030: a projected 8.5 billion.
- 2050: a projected 9.7 billion, after adding 1.18 billion in two decades.
Since the peak of the 1960s, the pace of growth has slowed by more than half. The reason given is reduced fertility: families in most parts of the world now have fewer children than their grandparents did. The slowdown is expected to continue through the coming decades and to the end of this century.
A falling growth rate does not mean a falling population. In 2020 the world grew by less than one percent, but one percent of nearly 8 billion is still close to 80 million extra people in a single year. The population keeps rising; it simply rises more slowly.
Why a Projection Is Uncertain
A projection is not a count. It is an estimate of what the figures will be in the future, and it rests on assumptions about fertility and mortality in every country. Change the assumption about how many children women will have in 2040, and the projected total for 2050 changes with it. So a projection of the world's population is uncertain by its nature, and the further ahead it looks, the more uncertain it becomes.
The near future, however, is relatively certain. The size and age structure of the population over the next few decades are largely the result of demographic processes that have already happened. Most of the women whose offspring will add to the population up to 2050 are already alive, so the number of future mothers is known even if the number of future babies is not. Meanwhile the picture differs from place to place: some countries are still growing, some have reached stabilization, and some have begun to shrink.
Projection: an estimation of what figures will be in the future, based on present figures and assumptions.
Demographic: relating to the population and the different groups within it.
Stabilization: the process of making somebody or something unlikely to change; for a population, the point where its size stops rising or falling.
The Regions of the World from 2022 to 2050
In 2022 the two most populous regions were Eastern and South-Eastern Asia, with 2.3 billion people or 29 percent of the world, and Central and Southern Asia, with 2.1 billion or 26 percent. China and India each had more than 1.4 billion people, the largest populations in these regions.
Two regions that look alike in size have very different histories. Europe and Northern America had more than 1.1 billion people in 2022 and sub-Saharan Africa more than 1.2 billion, but they arrived there along very different trajectories. Europe and Northern America have grown by less than one percent a year since the mid-1960s, and their growth rate was close to zero in 2020 and 2021. Sub-Saharan Africa's annual growth peaked at three percent in 1978 and stayed above 2.8 percent through the 1980s. Since then it has been the fastest growing region on Earth.
The smallest region is Oceania. Its two parts together held almost 44.8 million people in 2022. Oceania without Australia and New Zealand had only 2.5 million people in 1950 and reached close to 13.6 million in 2022. The table gives the figures in millions under the medium scenario, the middle of the United Nations' range of estimates.
| Region | 2022 | 2030 | 2050 |
| World | 7942 | 8512 | 9687 |
| Sub-Saharan Africa | 1152 | 1401 | 2094 |
| Northern Africa and Western Asia | 549 | 617 | 771 |
| Central and Southern Asia | 2075 | 2248 | 2575 |
| Eastern and South-Eastern Asia | 2342 | 2372 | 2317 |
| Latin America and the Caribbean | 658 | 695 | 749 |
| Australia and New Zealand | 31 | 34 | 38 |
| Oceania (without Australia and New Zealand) | 14 | 15 | 20 |
| Europe and Northern America | 1120 | 1129 | 1125 |
| Least developed countries | 1112 | 1338 | 1914 |
| Landlocked developing countries | 557 | 664 | 947 |
| Small island developing states | 74 | 79 | 87 |
Because the regions will grow at different rates over the next three decades, the map of world population in 2050 will look quite different from today's. The main changes projected are these.
- Central and Southern Asia is expected to become the most populous region by 2037, because Eastern and South-Eastern Asia could start to decline by the mid-2030s. The table shows it: Eastern and South-Eastern Asia falls from 2372 million in 2030 to 2317 million in 2050.
- Sub-Saharan Africa is expected almost to double between 2022 and 2050, passing two billion by the late 2040s. With fertility still close to three births per woman in 2050, it will supply more than half of the world's growth. In 2022 it was growing at 2.5 percent a year, the highest of the eight regions and more than three times the world average of 0.8 percent.
- Europe and Northern America are projected to reach their peak and begin to decline in the late 2030s, because their fertility has stayed low for so long.
- More than half of the world's growth up to 2050 will come from just eight countries: the Democratic Republic of the Congo, Egypt, Ethiopia, India, Nigeria, Pakistan, the Philippines and the United Republic of Tanzania. The Congo and Tanzania are expected to grow rapidly, by two to three percent a year.
- Disparate growth rates will reorder the largest countries. India was projected to surpass China as the world's most populous country in 2023.
Trajectory: a path followed by something; in a report on population, the pattern of growth over time.
The Silent /r/
Say the word 'world' the way a newsreader on British radio would: /wɜːld/. The letter r is written, but no /r/ sound is made. This is one of the most useful rules in English pronunciation, because the spelling cannot be trusted to tell you.
The /r/ rule: in standard British English, the letter r is pronounced only when a vowel sound comes straight after it. Before a consonant sound, or at the end of a word spoken on its own, the r is silent.
So 'growth' keeps its /r/, because the r is followed by a vowel sound. 'Birth' loses it, because the r is followed by /θ/. The same word can contain both kinds: in 'furthermore' all three r's come before a consonant sound or at the end, so none is heard. Here are the words from this unit sorted by the rule.
| Pronounced with /r/ sound | Pronounced without /r/ sound |
| growth /ɡrəʊθ/ | furthermore /ˈfɜːðəmɔː/ |
| experience /ɪkˈspɪəriəns/ | fertility /fəˈtɪləti/ |
| comparable /ˈkɒmpərəbl/ | uncertain /ʌnˈsɜːtn/ |
| zero /ˈzɪərəʊ/ | future /ˈfjuːtʃə/ |
| distribution /ˌdɪstrɪˈbjuːʃn/ | birth /bɜːθ/ |
| concentrated /ˈkɒnsntreɪtɪd/ |
Do not decide by looking for the letter r in the spelling. Decide by listening to what comes after it. 'Future' ends in r then e, but the e is silent, so the r ends the word and is not pronounced. 'Zero' has the r between two vowel sounds, so it is pronounced.
American English pronounces the r in almost every position, so you will hear /wɜːrld/ in American films. Both are correct English. The rule above is the British pattern that school pronunciation exercises follow.
Interpreting a Figure or a Chart Aloud
To interpret a picture or a chart is to explain in your own words what it shows and what it means. When you do it aloud to friends, begin by saying what the figure is about, then take the listener through it in a sensible order: in time order for a sequence of pictures, from largest to smallest for a table of figures. These phrases help.
- To open: 'This figure shows...', 'The chart gives the percentage of...'
- To order a sequence: 'First...', 'Next...', 'After that...', 'Finally...'
- To pick out the key facts: 'The most common...', 'The smallest share...', 'Just over a third...'
- To compare: 'compared with', 'while', 'whereas', 'twice as many as'
- To close: 'Overall...', 'In short...', 'This tells us that...'
The first figure is a sequence of four pictures showing first aid for an unconscious person. A sequence is interpreted as steps, each one said in the order it happens.
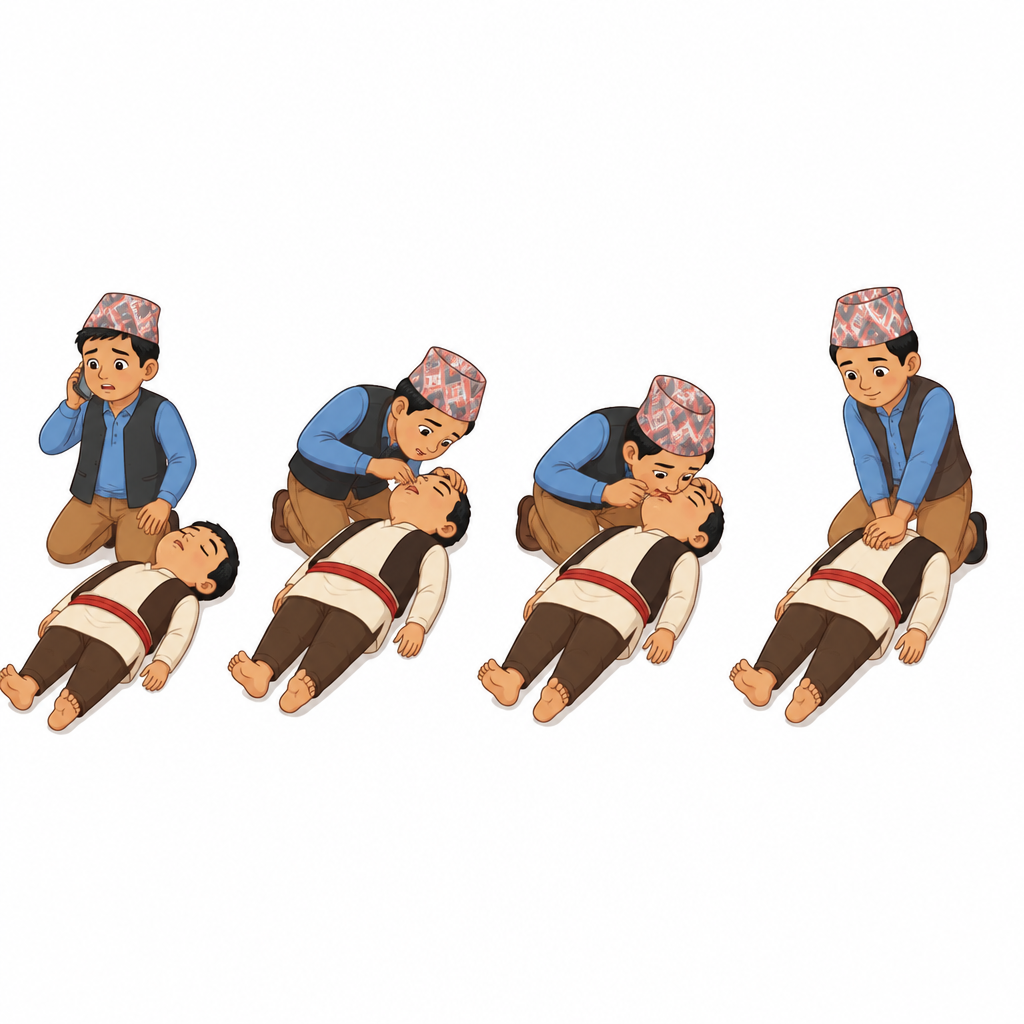
- First, the helper kneels beside the person lying on the ground and phones for emergency help.
- Next, the helper tilts the person's head back to open the airway and looks, listens and feels for breathing.
- Then, if the person is not breathing, the helper gives rescue breaths into the person's mouth.
- Finally, the helper kneels beside the chest and presses down firmly on the centre of it with both hands, one on top of the other, to keep the blood moving.
These pictures describe the order of the steps only. Rescue breaths and chest presses on a real person should be given by someone trained in first aid. If you find an unconscious person, calling for emergency help comes first.
The second figure is a table of household facilities in Nepal, taken from the National Population and Housing Census 2011. Each figure is the percentage of households that had that facility.
| Facility | Percent of households |
| Mobile phone | 64.6 |
| Radio | 50.8 |
| Television | 36.5 |
| Cycle | 32.4 |
| Cable television | 19.3 |
| Motorcycle | 9.6 |
| Telephone | 7.4 |
| Computer | 7.3 |
| Refrigerator | 7.2 |
| Internet | 3.3 |
| Motor | 1.6 |
| Other vehicle | 0.7 |
A spoken interpretation might run like this: 'This table shows how many Nepali households had different facilities in 2011. The mobile phone was the most common, found in 64.6 percent of homes, followed by the radio at just over half. About a third of households had a television, and almost a third owned a bicycle. Newer facilities were still rare. Fewer than one home in ten had a computer, a landline telephone or a refrigerator, and only 3.3 percent had the internet. Among vehicles, motorcycles led at 9.6 percent, while cars and other motor vehicles were owned by fewer than two homes in a hundred. Overall, the table tells us that in 2011 most families were connected by mobile phone and radio, but computers, the internet and cars had not yet reached most homes.'
Connectives of Contradiction
Sometimes the second half of a sentence is not what the first half leads you to expect. 'It was raining heavily' leads you to expect the match to stop. If it did not stop, English marks the surprise with a connective of contradiction. Choosing the right one depends on what comes after it: a full clause, a noun phrase, or a whole new sentence.
Connective of contradiction (contrast): a word or phrase that joins two ideas when the second is surprising or unexpected in the light of the first. Examples are although, though, even though, despite, in spite of, however, nevertheless, but, yet, while and whereas.
| Connective | What follows it | Example |
| although, though, even though | a full clause with a subject and a verb | Although it was raining heavily, we continued the match. |
| despite, in spite of | a noun, a pronoun or an -ing form | Despite the heavy rain, we continued the match. |
| despite the fact that, in spite of the fact that | a full clause | In spite of the fact that it was raining, we continued the match. |
| however, nevertheless | a new sentence, or a clause after a semicolon, with a comma after the connective | It was raining heavily. However, we continued the match. |
| but, yet | the second clause of the same sentence, usually after a comma | It was raining heavily, yet we continued the match. |
| while, whereas | a clause that sets two different facts side by side | I love watching cricket, while my brother loves football. |
Although, though and even though are followed by a clause. Even though is the strongest of the three and stresses the surprise: 'Dolma was selected for the post even though she had no prior experience for the job.'
Despite and in spite of are followed by a noun, a pronoun or an -ing form, never by a clause: 'He did not give up smoking in spite of the warnings of the doctor.' 'Chintamani never joins social functions despite looking very sociable.' To use a clause, add 'the fact that': 'Christina attended the class despite the fact that she was not feeling well.'
However and nevertheless link two separate sentences. They usually begin the second sentence and are followed by a comma: 'Kripa exercises every day. However, she is gaining weight.'
But and yet join two clauses inside one sentence. Yet carries a stronger sense of surprise: 'It was snowing heavily, yet it was not too cold.'
While and whereas set two facts side by side to show how they differ, rather than to show surprise: 'Europe's population is close to its peak, whereas sub-Saharan Africa's is still rising fast.'
A clause introduced by although, though or even though can come first or second in the sentence. When it comes first, put a comma at the end of it: 'Although we had the map of the town with us, we were lost.' When it comes second, the comma is usually left out: 'We were lost in the town although we had the map with us.'
Never write 'despite of'; it is either 'despite' or 'in spite of'. Never use two contrast words for one contrast: 'Although he was tired, but he finished the work' is wrong, because although already does the job. And never put a clause after despite or in spite of: 'In spite of he was tired' is wrong; write 'In spite of being tired' or 'In spite of the fact that he was tired'.
Joining two sentences with a given connective is a common task. Take 'I was really exhausted. I could not sleep well.' with the connective 'although'.
- Step 1: Find the surprise. Being exhausted should make you sleep well, so 'I could not sleep well' is the unexpected part.
- Step 2: Check what the connective needs. 'Although' needs a full clause, and 'I was really exhausted' already is one.
- Step 3: Put the connective in front of the expected part, not the surprise: 'Although I was really exhausted'.
- Step 4: Add a comma and the surprise: 'Although I was really exhausted, I could not sleep well.'
With 'despite' or 'in spite of', one more step is needed, because the clause must become a noun phrase or an -ing form. 'She had badly injured her hand' becomes 'having badly injured her hand', which gives 'Despite having badly injured her hand, Dipisha completed her assignment.'
Writing an Interpretation of a Graph or Chart
A written interpretation turns a graph or chart into clear paragraphs. The reader should be able to understand the main message without seeing the picture. It is a piece of reporting, so it stays factual: you describe and compare, and you keep your own opinion out unless the task asks for it. Build it in this order.
- Step 1: Introduce the graphic. Say what kind it is, what it measures, and the place and period it covers.
- Step 2: Give the overall picture in one or two sentences: the main trend in a bar or line graph, the largest share in a pie chart.
- Step 3: Pick out the key figures and quote them exactly: the highest, the lowest, the biggest rise or fall.
- Step 4: Compare, using words such as while, whereas, compared with, twice as many and more than half.
- Step 5: Close with a short conclusion that sums up what the figures show.
The language of change is worth learning as a set. For a rise: rose, increased, climbed, jumped, grew steadily, reached a peak of. For a fall: fell, dropped, declined, decreased, reached a low of. For no change: remained steady, stayed the same. For shares: accounted for, made up, the largest share, followed by, a distant second. Use the past tense for figures from the past, and the present tense for what the chart itself shows: 'The chart shows...'.
The first graphic to interpret is a bar graph of the number of Nepali students who went abroad to study each year from 2009/10 to 2018/19.
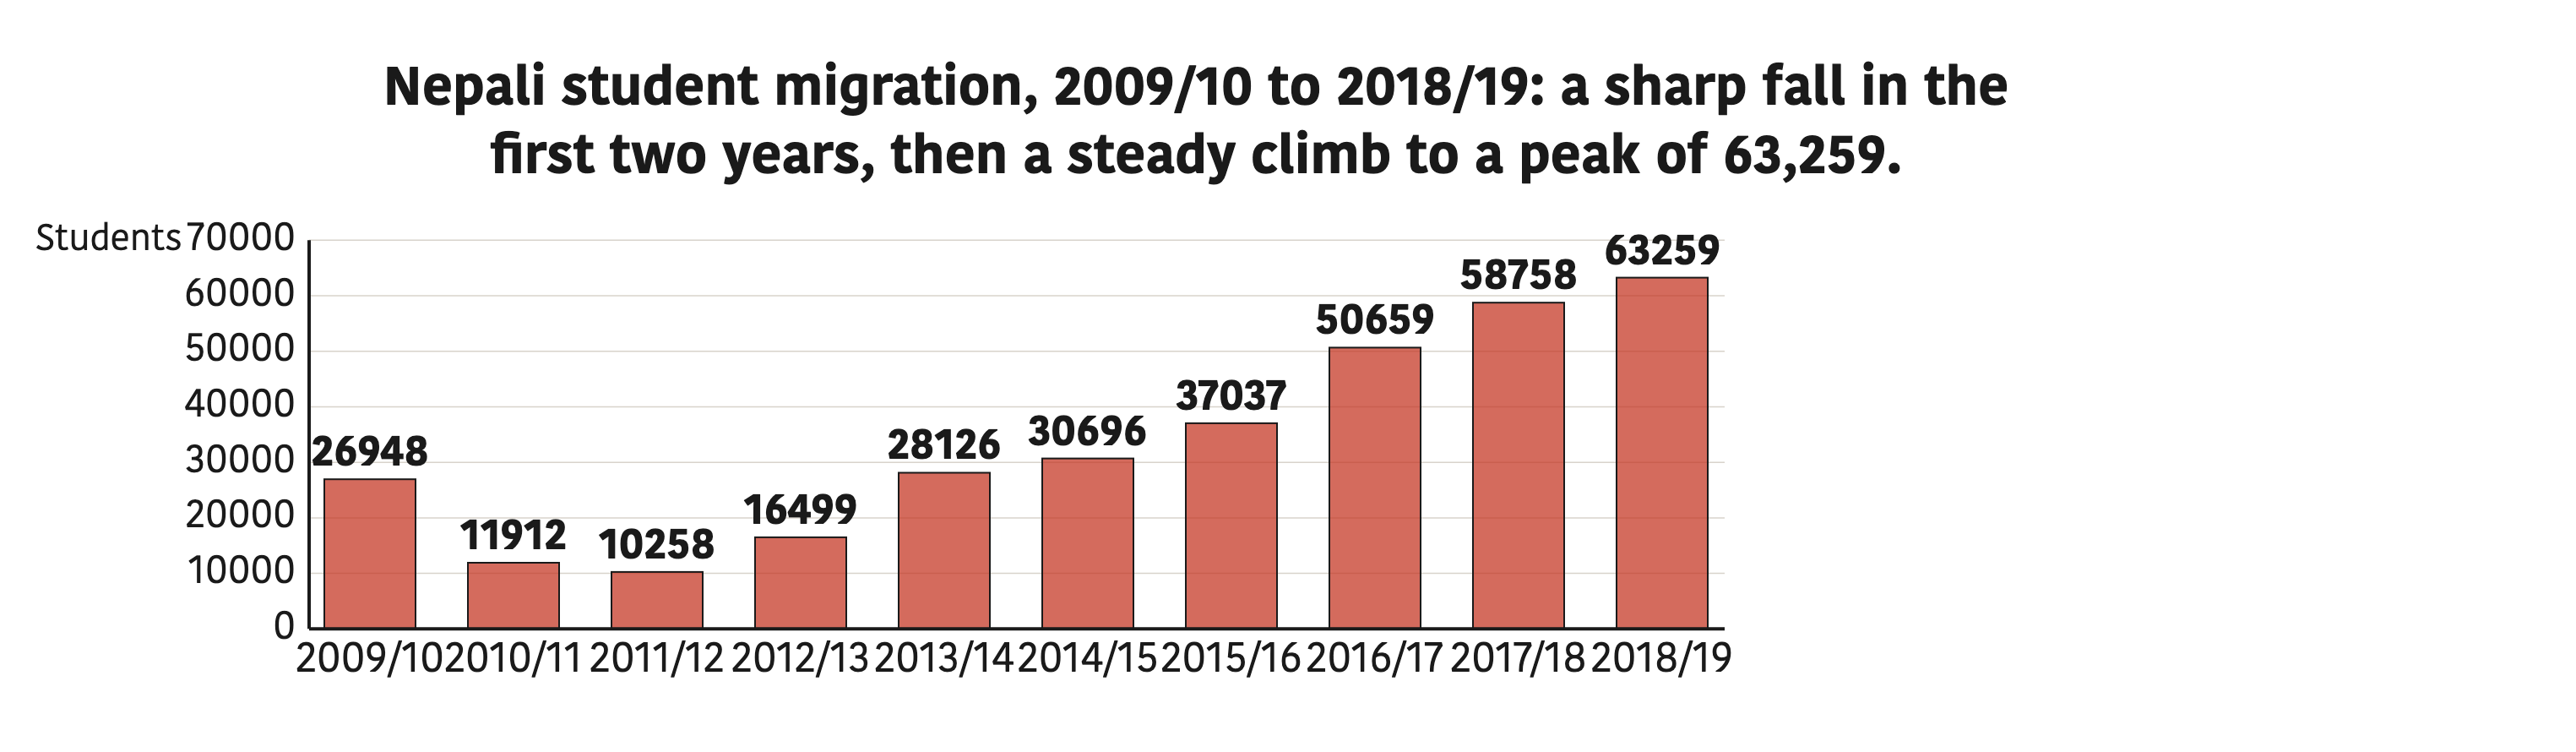
| Year | Students |
| 2009/10 | 26948 |
| 2010/11 | 11912 |
| 2011/12 | 10258 |
| 2012/13 | 16499 |
| 2013/14 | 28126 |
| 2014/15 | 30696 |
| 2015/16 | 37037 |
| 2016/17 | 50659 |
| 2017/18 | 58758 |
| 2018/19 | 63259 |
The second is a pie chart of the population of Kathmandu Metropolitan by mother tongue, from the population census of 2011. A pie chart shows parts of one whole, so its interpretation is about shares rather than about change over time.
| Language | Speakers | Share |
| Nepali | 597,570 | 61.26% |
| Newar | 185,330 | 19.00% |
| Tamang | 54,109 | 5.55% |
| Maithili | 27,521 | 2.82% |
| Hindi | 17,608 | 1.81% |
| Bhojpuri | 15,621 | 1.60% |
| Gurung | 11,963 | 1.23% |
| Magar | 11,319 | 1.16% |
| Sherpa | 10,173 | 1.04% |
| Others | 44,239 | 4.54% |
Model interpretations of both graphics are in the worked examples.
How Birds Migrate
The second reading, 'Discovering Migration: What Birds Reveal', is a piece of popular science writing. It opens with a puzzle and then answers it with facts, figures and examples from around the world. Before reading, think about two questions: have you ever noticed birds or animals arriving in or leaving your area at a certain time of year, and why do you think they do it?
The puzzle is this. A snow-covered forest is quiet in winter, yet in spring the same place is full of the chirps, chatter and calls of birds. Where were they? People in the past had strange answers. Some believed birds slept through the winter in holes they dug in the ground. Others thought they hid, alive, in the mud at the bottom of ponds, waiting for spring. Others claimed that familiar summer birds transformed into different kinds of birds in winter. The truth is more incredible than any of these. The birds migrate. They fly over land and oceans, without a roadmap or a compass, to destinations that may be thousands of miles away.
Like marathon runners, migrating birds pace themselves so that they do not run out of energy before they can land. They keep adjusting their speed, height and flight path to allow for changing winds, storms and their own weight. In spring they retrace their paths back to their summer homes. The numbers are enormous. Each autumn about five billion birds fly south from North America for the winter, and about 500 of North America's 650 bird species migrate. Across the world, more than half of all bird species, about 5,000 of them, migrate, and each species makes its own journey.
Birds are not the only travellers. Insects, amphibians, reptiles, fish and mammals migrate too, and somewhere on Earth a migration is always happening.
| Animal | When | Where it goes |
| Herds of wildebeest | Every January | Green pastures in the southern Serengeti of Africa |
| Swarms of free-tailed bats | Each March | Caves in Texas |
| Northern fur seals | Each June | Islands off Alaska |
| Chinook salmon | In September | Up the rivers of Washington State |
You would need to be in the right place at the right time to witness these journeys. Birds, though, can be seen migrating almost anywhere, which is why so much of what we know about migration comes from studying them.
Not every journey runs from north to south. Some birds travel from east to west. White-winged scoters are diving ducks that can stay underwater for up to a minute to grab shellfish from the ocean floor. They spend the summer near ponds and lakes in Alaska and western Canada, and in autumn they fly to the milder Pacific and Atlantic coasts, where there is less snow. Other birds hardly travel any distance at all, yet still find a very different climate, because they move up and down instead of north and south. Mountain birds such as brindled titmice and mountain chickadees drop about 1,000 feet to lower elevations, leaving high evergreen forests for wooded valleys and streams.
Even within one species, some birds migrate and some do not. This is partial migration. Robins are seen as a sign that spring has arrived in the northern states of America, because they fly south for the cold months and return. Yet some robins live all year round in the South and never make the journey.
Partial migration: a pattern in which some birds of a species migrate while others of the same species stay where they are all year.
Some species fly nonstop, but most birds stop on the way. Sea terns cannot rest on the ocean for long because their feathers become waterlogged, so they must keep going. For most birds, stopping to rest and refuel is the normal pattern. Even a small cluster of bushes with berries can give crucial energy to a bird on the move. Birds may stay at a stopover for a few days or a few weeks, depending on how much energy they need, and they may wait there for better weather or winds before the next leg of the journey.
Stopover (also called a layover): a place where migrating birds stop on their journey to rest, feed and wait for good weather before flying on.
Some stopovers draw huge crowds. A 75-mile stretch of the Platte River in Nebraska gathers up to nine million birds each spring, which feed in the fertile wetlands along the river. Almost all of the world's sandhill cranes, about 500,000 birds, spend around six weeks there. They eat mostly corn, which quickly builds up fat for the rest of the journey, and then they continue north to Canada, Alaska and Siberia. Some journeys are long and perilous. Many kinds of ducks and other water birds fly all the way from Siberia to Nepal to escape the cold.
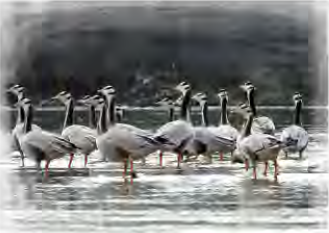
Birds may travel by day, by night, or both. Ducks, geese and swans fly both day and night. Some day travellers feed as they go: swallows and swifts catch flying insects on the wing. Most songbirds, by contrast, feed and rest in the day and fly at night, probably because the cooler, calmer night air makes flying easier. In the dark sky they are almost invisible, and only their chattering gives them away. They can be seen when they pass in front of the moon, and moon watching is in fact one way of counting night migrants. In the migration season a moon watcher may count as many as 200 birds an hour.
Listening for Facts about Wildlife
The listening task is a short report on the state of the world's wildlife, based on findings of the World Wildlife Fund (WWF). Before you hear it, prepare by thinking about two questions: what is the state of animal populations in the world today, and why is wildlife important to human beings? Having your own ideas ready helps you recognise the key points when they come.
While you listen, you fill six gaps with a word or phrase. Read every gap before the recording starts and decide what kind of information it needs, because knowing what you are listening for is half the task.
- 'According to World Wildlife Fund, we need to overhaul the way we ......' needs an action, something people do.
- 'The wildlife across the world is ......' needs a description of the condition wildlife is in.
- 'The population of animals and birds has decreased by ...... in the past 50 years' needs a percentage.
- 'World Wildlife Fund monitored about ...... animal species in its study' needs a number.
- 'Agriculture is responsible for ...... of deforestation in the world' needs a share: a percentage or a fraction.
- 'We can save the wildlife for the future generation by ......' needs a way of doing something, usually a verb ending in -ing.
Then you answer four questions in not more than four words each: what the decline in wildlife indicates, what the biggest reason is for the destruction of wild animals' habitats, where terrestrial species live, and where we should look to stop the decline. Terrestrial means living on land, so listen for the kinds of land habitat the speaker names. Last comes a discussion: what is Nepal doing to save its wildlife?
- Listen for signal words: 'according to', 'about', 'percent', 'responsible for', 'by'. The answer usually comes just after them.
- Numbers are easy to mishear. Fifteen and fifty, sixty and sixteen sound alike, so listen for the stress.
- Write short notes during the first listening and check them during the second.
- Make sure your answer fits the grammar of the gap.
When a question says 'not more than four words', a fifth word loses the mark even if the idea is right. Count before you move on.
Writing an Opinion Essay on Migration
Every year a large number of young people and professionals leave Nepal to study or work abroad. The writing task asks for an essay giving your opinion on the impacts of this migration and suggesting solutions to the problems it causes. An opinion essay is different from an interpretation of a chart: here your view is the point, but it must be supported by reasons and examples.
- Introduction: set out the situation in two or three sentences and state your opinion clearly.
- Body paragraph on positive impacts: money sent home, new skills and experience, contacts with the wider world.
- Body paragraph on negative impacts: the loss of skilled and educated people (often called brain drain), villages left with only the old and the very young, families separated, workers exploited abroad.
- Body paragraph on solutions: more jobs and fair pay at home, support for young people starting businesses, better universities, safe and legal channels for those who do go, and ways to bring skills back.
- Conclusion: sum up and restate your opinion in fresh words.
This is where the connectives of contradiction earn their place. An opinion essay weighs two sides, and words such as although, despite, however and whereas let you do that in a single sentence: 'Although money sent from abroad helps many families, it cannot replace the doctors and engineers the country has lost.' A model essay is in the worked examples.
A Report on Migratory Birds and Animals of Your Locality
The project is a group report on the birds and animals that migrate to or from the place where you live. A report is organised for a reader who wants facts quickly, so it uses a title, short sections with headings, and plain, factual sentences.
- Title: 'Migratory Birds/Animals of our Locality'.
- Introduction: where the study was done, when, and how the information was gathered, for example by watching, asking local elders or reading.
- Names of the birds or animals.
- Reasons for their migration: cold, food, breeding, water.
- Time or season of the migration.
- Activities during the migration: feeding, resting, nesting.
- Duration: how long they stay or how long the journey lasts.
- Conclusion: a short summary, and any threats the birds or animals face.
Nepal has plenty to study. In winter, ducks, geese and other water birds from Siberia and Central Asia arrive at wetlands such as Koshi Tappu, Ghodaghodi Lake and Jagdishpur Reservoir. Bar-headed geese cross the Himalaya on their way south. In spring and summer, birds such as cuckoos arrive from the south to breed. Hill farmers also move their herds up to high pastures in summer and down again in winter, which is a migration of animals led by people.
The full lesson is waiting for you
The notes are free to read in full. A free account opens the rest of the practice, and tracks your progress and confidence score for every subject. Presentations and videos need approval from Learn Yeti.